Now, we are ready to handle the topic of missing data. I delayed this discussion not because it is complicated but because I wanted to give you time to get comfortable with dataframes. We will continue to use the data from dummy-class_1-of-2.xlsx for this section.
1 Missing data
We know from info() that ‘Test 1’ and ‘Test 2’ are missing some data.
df_class.info()
<class 'pandas.core.frame.DataFrame'>
Index: 35 entries, A3028967J to A7667457P
Data columns (total 7 columns):
 #   Column     Non-Null Count  Dtype
---  ------     --------------  -----
 0   MATRIC_NO  35 non-null     object
 1   Name       35 non-null     object
 2   Major      35 non-null     category
 3   Gender     35 non-null     category
 4   Test 1     33 non-null     float64
 5   Test 2     32 non-null     float64
 6   Total      31 non-null     float64
dtypes: category(2), float64(3), object(2)
memory usage: 2.0+ KB
1.1 All missing data
First, let’s see if we can get the exact locations of the missing data. Let’s start with the method isna().
df_class.isna()
MATRIC_NO
Name
Major
Gender
Test 1
Test 2
Total
MATRIC_NO
A3028967J
False
False
False
False
False
False
False
A1282849W
False
False
False
False
False
False
False
A5408925A
False
False
False
False
False
False
False
A6973859L
False
False
False
False
False
False
False
A5410124H
False
False
False
False
False
True
True
A9568373Q
False
False
False
False
False
False
False
A6824244G
False
False
False
False
False
False
False
A9194090U
False
False
False
False
False
False
False
A4828364M
False
False
False
False
False
False
False
A4607700C
False
False
False
False
False
False
False
A7067766E
False
False
False
False
False
False
False
A5569996J
False
False
False
False
False
False
False
A3202548I
False
False
False
False
False
False
False
A6131593U
False
False
False
False
False
False
False
A7653832E
False
False
False
False
True
False
True
A9462811I
False
False
False
False
False
False
False
A1218599T
False
False
False
False
False
False
False
A7210476B
False
False
False
False
False
False
False
A1512479K
False
False
False
False
False
False
False
A7986368Y
False
False
False
False
False
False
False
A2727061A
False
False
False
False
False
True
True
A2999472W
False
False
False
False
False
False
False
A7116486E
False
False
False
False
False
False
False
A6931452S
False
False
False
False
False
False
False
A9649096H
False
False
False
False
False
False
False
A1643380L
False
False
False
False
False
False
False
A6787293E
False
False
False
False
False
False
False
A5975988J
False
False
False
False
False
False
False
A3699958T
False
False
False
False
True
True
True
A1956366U
False
False
False
False
False
False
False
A1468689D
False
False
False
False
False
False
False
A3217320C
False
False
False
False
False
False
False
A6867791C
False
False
False
False
False
False
False
A4080490P
False
False
False
False
False
False
False
A7667457P
False
False
False
False
False
False
False
The missing data is where you see True. I hope that you will agree that this information is overwhelming and utterly useless. So, we need to have a way to get more refined information.
1.2 Columns and rows of the missing data
We can exercise more finesse by combining isna() with any(). any() in this case just asks if there are any True values. The axis option will allow us to pick the rows or columns (Honestly, I can never remember which is which, so I just try 0 or 1 and see what I get).
df_class.isna().any(axis=0) # Are there any True in the columns?
MATRIC_NO    False
Name         False
Major        False
Gender       False
Test 1        True
Test 2        True
Total         True
dtype: bool
df_class.isna().any(axis=1) # Are there any True in the rows?
How you handle missing numbers must depend on what type of data you are dealing with.
Here are a few things you can do:
Replacing the missing data with a constant value
For our dummy class, the numbers are missing because the students were missing from the tests. So, it is easy; we give them zero (the fourth option). The easiest way to do this is using fillna(). I will use a crazy value first so that you can see what is going on.
I was looking for a way to introduce iterating (looping) over a dataframe. Now is an excellent opportunity because we can use it to replace the missing data. But this is certainly not the best way because there are highly optimised weapons in the Panda’s arsenal like apply(), fillna() and so on. However, I (lazily) often find myself using loops because they are plain and simple to get started and understand.
You can loop through your dataframe using the method itterrows() as follows. It spits out the index and the row for every iteration.
for index, row in df_class.iterrows(): name = row['Name']for column in ['Test 1', 'Test 2']:if np.isnan(row[column]):print(f'{index}: {name:<15} missing data for {column}') df_class.loc[index, column] =0
If you run this, you should end up with the following:
    A5410124H: Kyla Young       missing data for Test 2
    A7653832E: Quentin Kemp     missing data for Test 1
    A2727061A: Malik Becker     missing data for Test 2
    A3699958T: Norah Miles      missing data for Test 1
    A3699958T: Norah Miles      missing data for Test 2
You can extract the various columns from the row variable just as you do with a dataframe (loc and iloc works too). I have used isnan() from NumPy to check for NaN because you cannot use ==. I am also using the index to update the original value of the dataframe. There are cautionary tales (e.g. see Nice of Loops) about changing something while iterating over it. However, it is safe in this case.
2 Combining dataframes
Now I will show you how to combine two datasets into one dataframe. Done correctly, Pandas makes quick, efficient work of this1.
The file dummy-class-2-of-2.xlsx contains the data for ‘Test 3’. You should open this file using Excel, LibreOffice or Sheets to see what it looks like.
I am going to import this data and call it df_class_2. I will also rename the columns and set the index to MATRIC_NO. This last point is crucial when combining the two dataframes because the index is used to match the rows.
df_class_2 = pd.read_excel('dummy-class-2-of-2.xlsx')#------------------------- Rename columns ------------------------#new_column_info = {'Student No': 'MATRIC_NO','Test 3 (50%)': 'Test 3'}df_class_2.rename(columns=new_column_info, inplace=True)#--------------------- Set index to MATRIC_NO --------------------#df_class_2.set_index('MATRIC_NO', inplace=True)df_class_2.info()
If you look at the output of info(), you will realise that students are missing! It turns out the person who created this file only included the scores for the students who were present at Test 3. If you were going to work with spreadsheets, this would have given you a migraine. But with Pandas, it is going to be a breeze.
Let me combine (concatenate) the two dataframe using the pd.concat() method. I will specify axis=1 so that the dataframes are joined along the columns (not one on top of each other along rows).
Let me show you the complete recipe for everything we have done in this part. I have reordered some actions (e.g. creation of the ‘Total’ column) and modified a few things (e.g. df_class_1 instead of df_class). I have also removed the excessive comments from the previous version. Everything should flow nicely and make sense to you.
# -----------------------------------------------------------------## First file ## -----------------------------------------------------------------#df_class_1 = pd.read_excel('dummy-class-1-of-2.xlsx', skiprows=1)columns_to_keep = ['Student No', 'Name', 'Major', 'Gender','Test 1 (30%)', 'Test 2 (20%)']df_class_1 = df_class_1[columns_to_keep]new_column_info = {'Student No': 'MATRIC_NO','Test 1 (30%)': 'Test 1','Test 2 (20%)': 'Test 2'}df_class_1.rename(columns=new_column_info, inplace=True)df_class_1.set_index('MATRIC_NO', drop=False, inplace=True)replace_info = {'PHY': 'Physics','CHM': 'Chemistry','LS': 'Life Sciences','CBIO': 'Comp. Biology','F': 'Female','M': 'Male','NB': 'Non-binary'}df_class_1.replace(to_replace=replace_info, inplace=True)def clean(text):''' Function to remove ' ' from column 'Test 2'. To be applied using apply() '''try:return text.replace("'", "")exceptAttributeError:# This will handle the NaN of the missing datareturn textdf_class_1['Test 2'] = df_class_1['Test 2'].apply(clean)new_type_info = {'Major': 'category','Gender': 'category','Test 2': 'float'}df_class_1 = df_class_1.astype(new_type_info)# -----------------------------------------------------------------## Second file ## -----------------------------------------------------------------#df_class_2 = pd.read_excel('dummy-class-2-of-2.xlsx')new_column_info = {'Student No': 'MATRIC_NO','Test 3 (50%)': 'Test 3'}df_class_2.rename(columns=new_column_info, inplace=True)df_class_2.set_index('MATRIC_NO', inplace=True)# ---------- Concatenate the two dataframes along columns ---------#df_combined = pd.concat([df_class_1, df_class_2], axis=1)# -----------------------------------------------------------------#df_combined.loc[:, ["Test 1", "Test 2", "Test 3"]].fillna(0, inplace=True)df_combined["Total"] = df_combined[["Test 1", "Test 2", "Test 3"]].sum(axis=1)df_combined.sort_values(by='Total', inplace=True)df_combined = df_combined.round(2)df_combined.to_excel('finalised_scores.xlsx', index=False)df_combined.head()
MATRIC_NO
Name
Major
Gender
Test 1
Test 2
Test 3
Total
MATRIC_NO
A3699958T
A3699958T
Norah Miles
Chemistry
Male
NaN
NaN
NaN
0.00
A6867791C
A6867791C
Katie Ayers
Comp. Biology
Female
16.53
10.28
NaN
26.81
A5410124H
A5410124H
Kyla Young
Physics
Male
15.31
NaN
17.5
32.81
A7210476B
A7210476B
Sidney Wiggins
Physics
Non-binary
19.59
14.68
NaN
34.27
A7667457P
A7667457P
Carter Crane
Life Sciences
Male
20.82
13.82
NaN
34.63
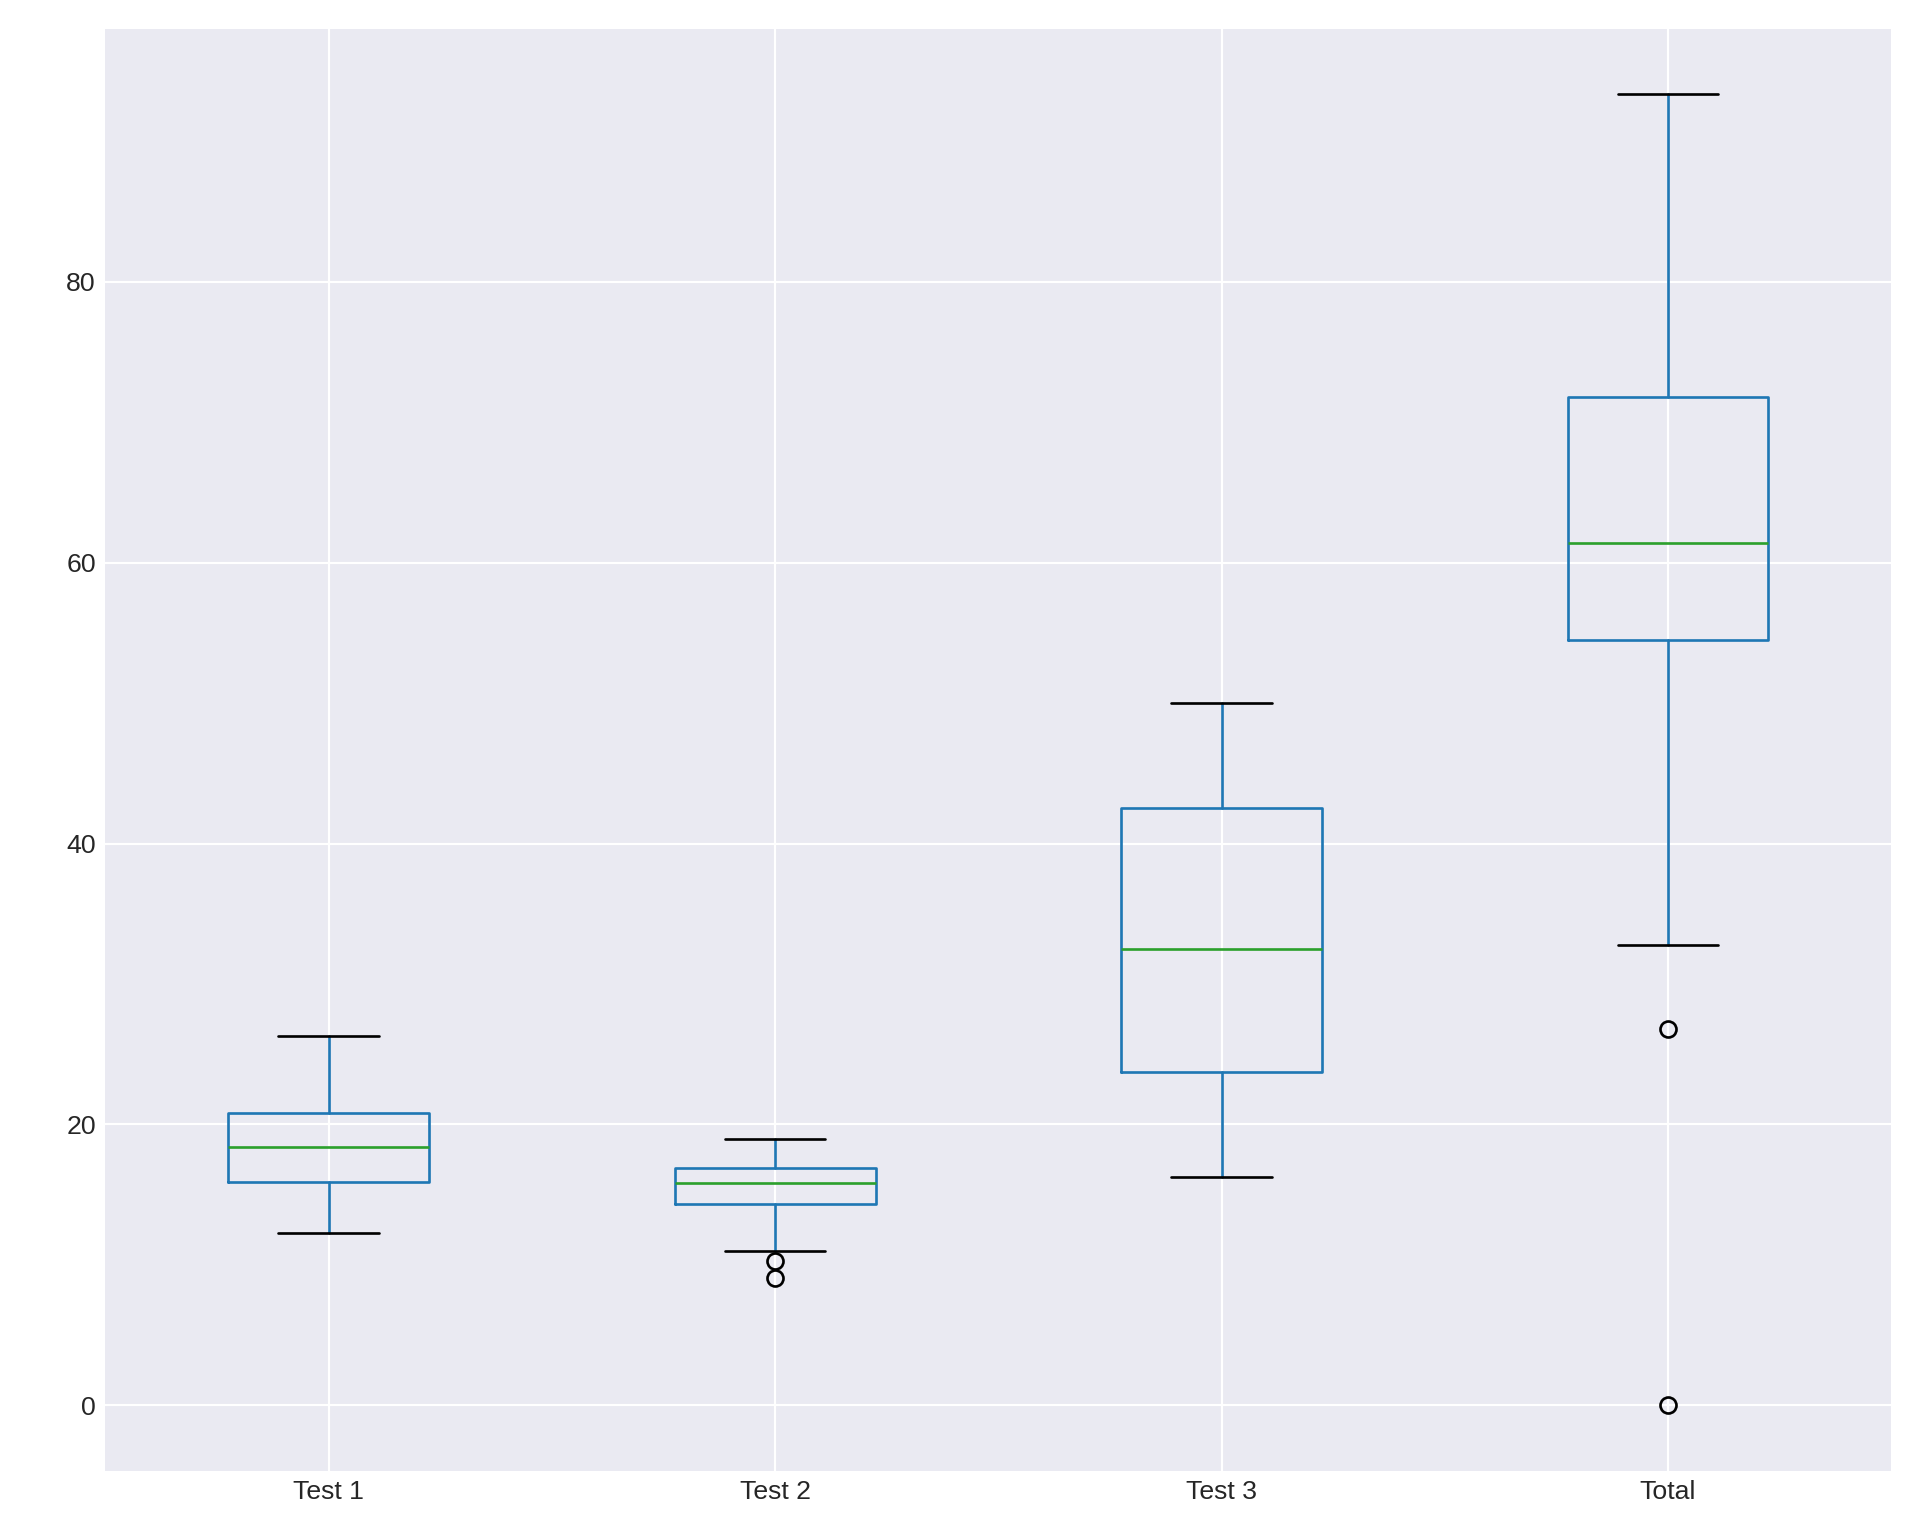
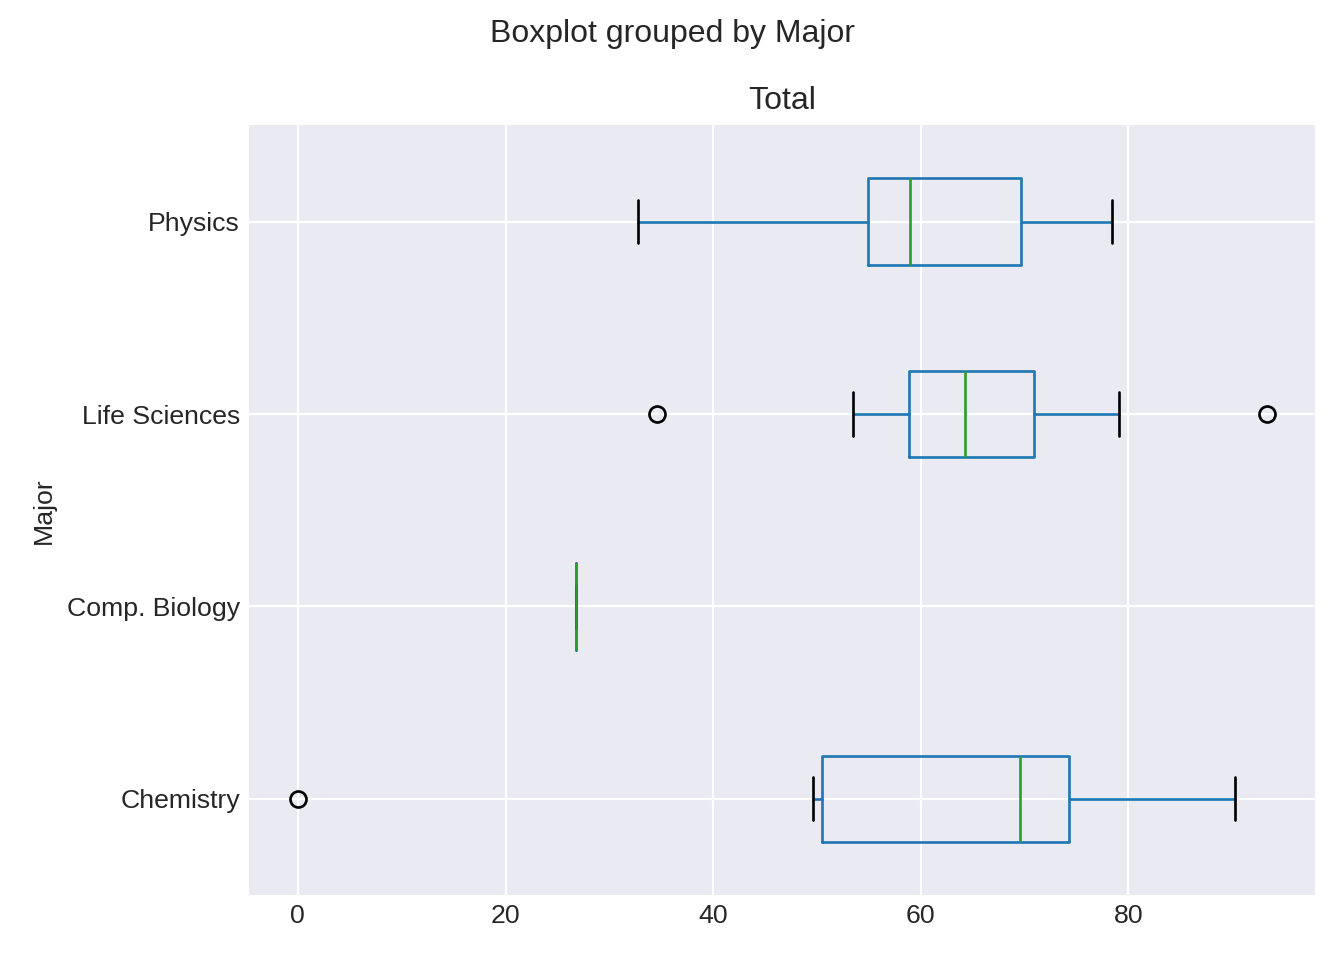
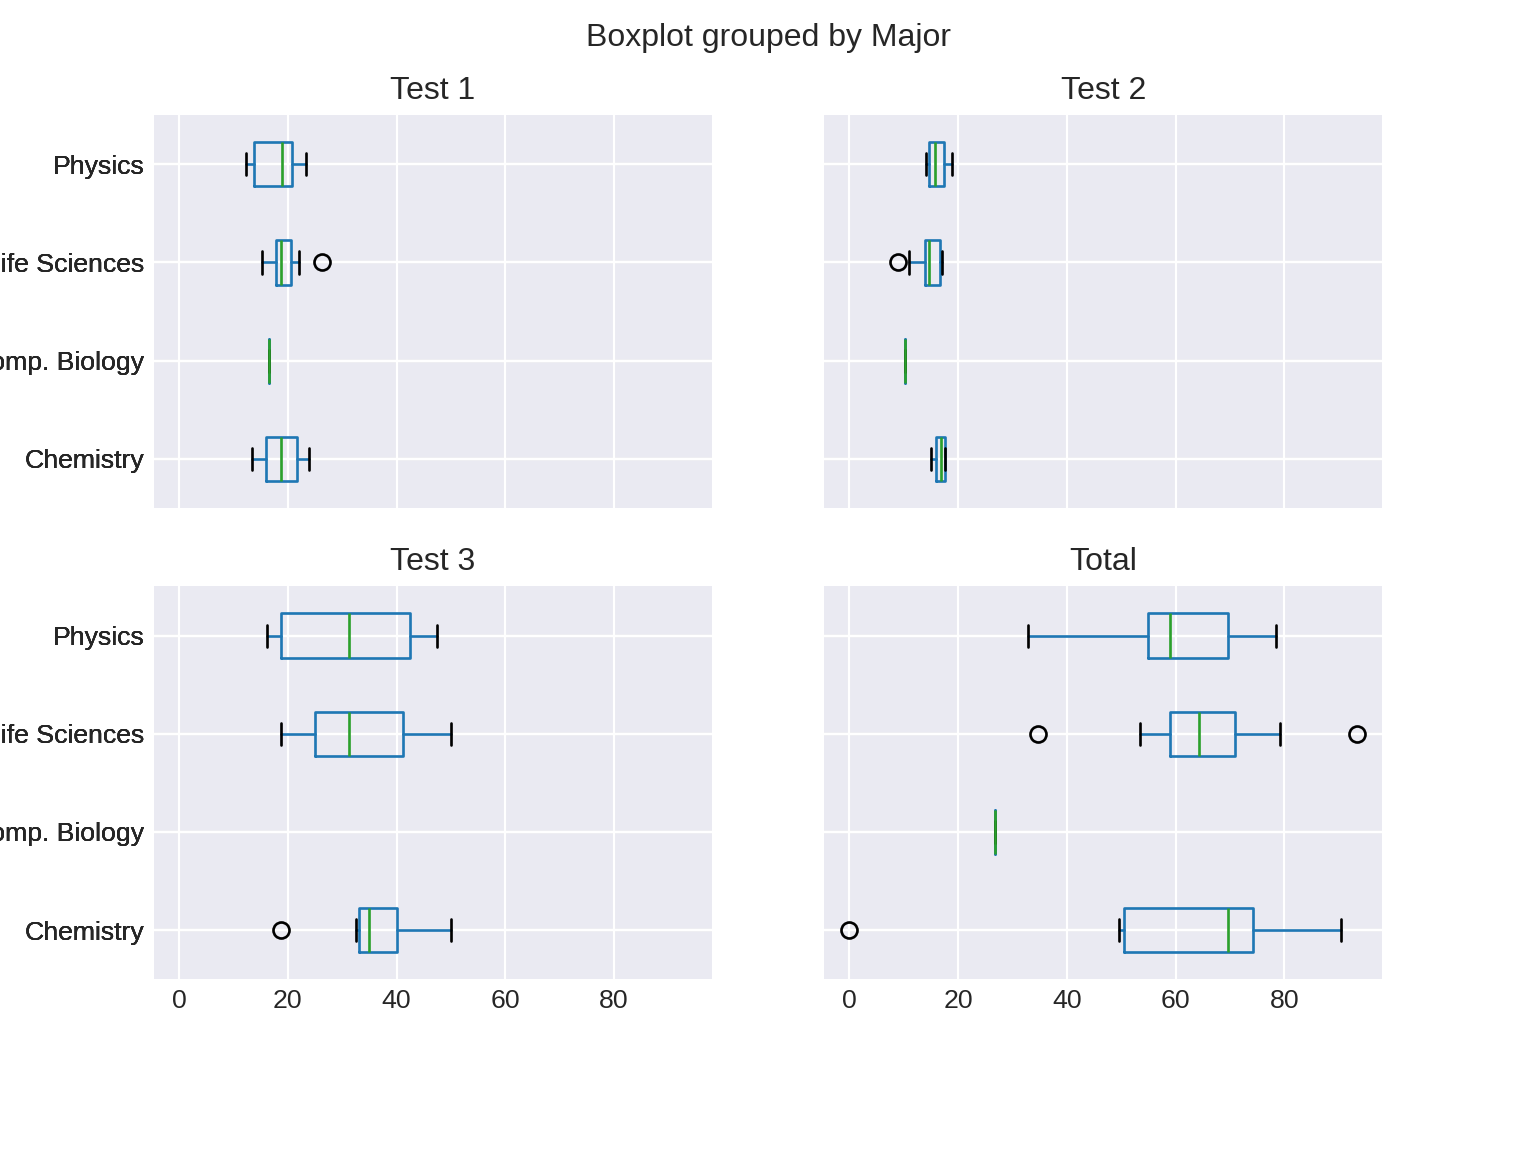
3 Plotting directly from Pandas
Pandas allow us to speak directly to Matplotlib from the dataframe. So, the last thing I want to show you is how to do this as it will save you a lot of time. Especially when you are in the exploratory phase of using data.
For the following, I will use the df_combined dataframe. I will also keep my infatuation with xkcd in check and use another style from Seaborn2.