09| A picture is worth thousands of data points
Introduction
A lot of data goes into creating an image. Or, put another way, we can extract many details by analysing an image. matplotlib allows you to do this quite easily. In this question, we will use matplotlib to quickly explore the topic of image analysis. For this, please download the zip file golgi-movie_robert_frames_gray.zip, which contains 17 fluorescence images collected by Dr Robert Lieu. The 17 images are a time series of the variation of a fluorescence marker protein.
The original images have been converted to grayscale (black & white) images to simplify this discussion.
Tasks
Lock and Load
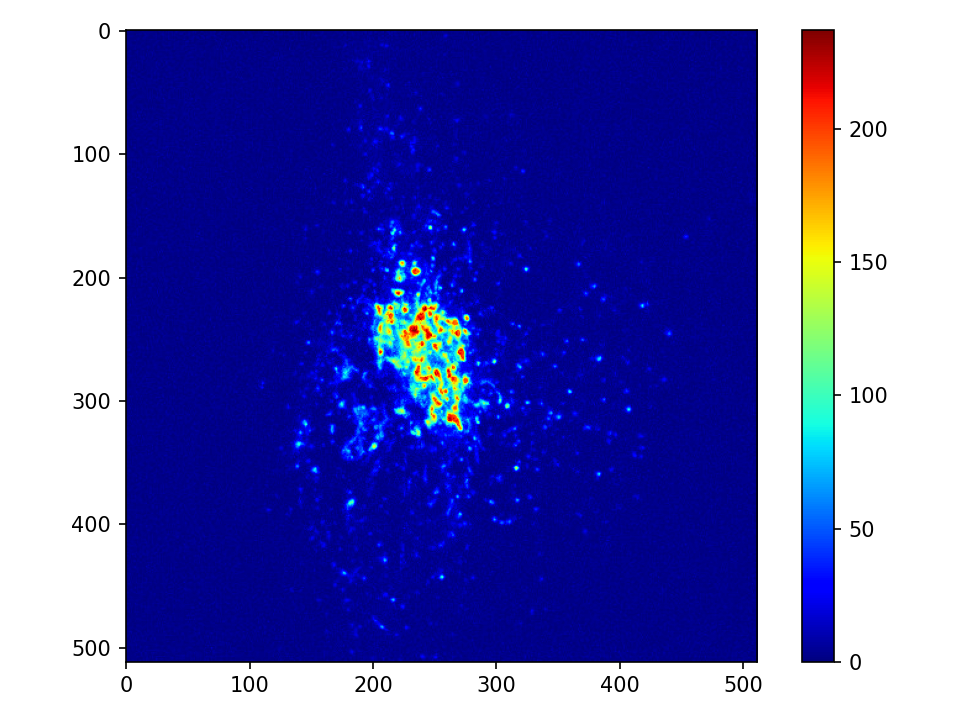
Use the following code to import and display one of the images. The cmap specifies the false-colour, colour scheme used to display the data.
img_data = plt.imread(file-name)
plt.imshow(img_data, cmap='jet')
plt.colorbar()
How is the data stored?
How is the image information stored by matplotlib? Let’s find out.
Determine the following:
- Type of
img_data. - Shape of
img_data. - Values of maximum, minimum and sum of
img_data. What do these numbers represent? - A histogram of all the values of
img_data. - The total counts of the image.
Hints:
flatten()might be useful.
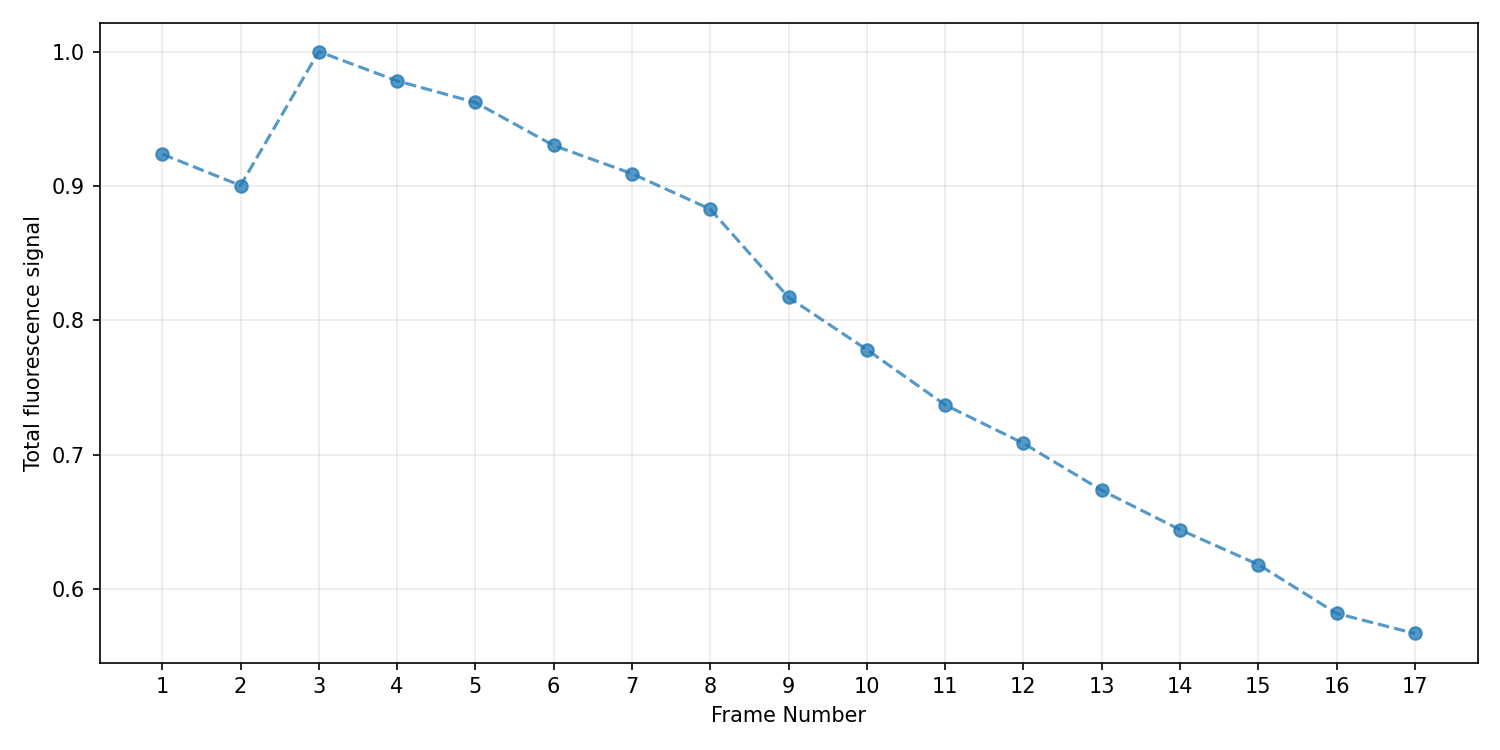
Plotting a trend
Write a snippet of Python code to produce the following plot that shows the variation of the total fluorescence intensity over time for the images provided.