10| About a Pendulum
Introduction
In this question, we will use our knowledge of segmentation analysis to develop tools for tracking motion. We will work with a simple video of a pendulum (pendulum.mp4) captured using my handphone. Once we track (i.e., extract its position-time information) the pendulum’s motion, we can plot and apply a more mathematical analysis to understand the motion better.
Oops: As you can see, the orientation of the video is wrong, sorry. Guess you will have to do something about that.
Tasks
Figure out a way to extract the individual frames of the video.
There are many ways (e.g., Python, ImageJ, ImageMagick, …) to do this so pick one that you like.
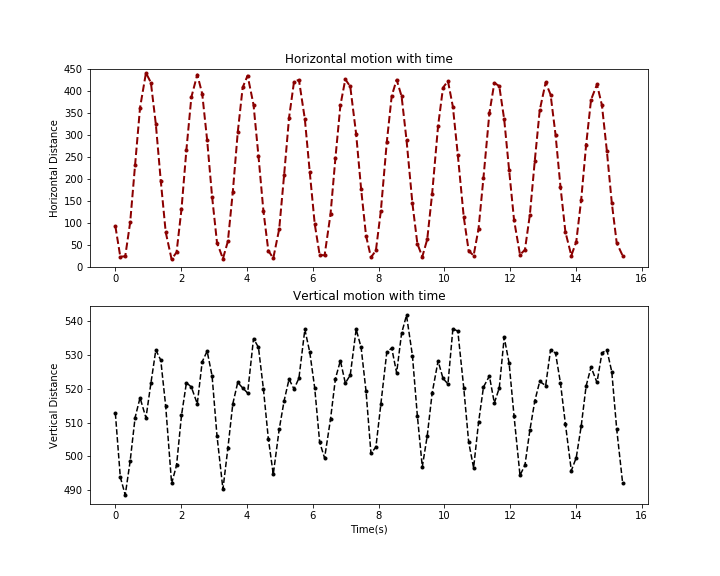
Please indicate what you used.Using either a ‘low-level’ approach using basic Numpy arrays or a ‘high-level’ approach using a package (e.g., scikit-image) extract the \((t,x,y)\) information of the pendulum bob and plot them.
Use the SciPy function
curve_fit()to fit a function of the form \(A \sin(2\pi f t + \alpha)\) to your tracking data. The results should look like the red line of the plot shown below.