13| Graduate Data
Introduction
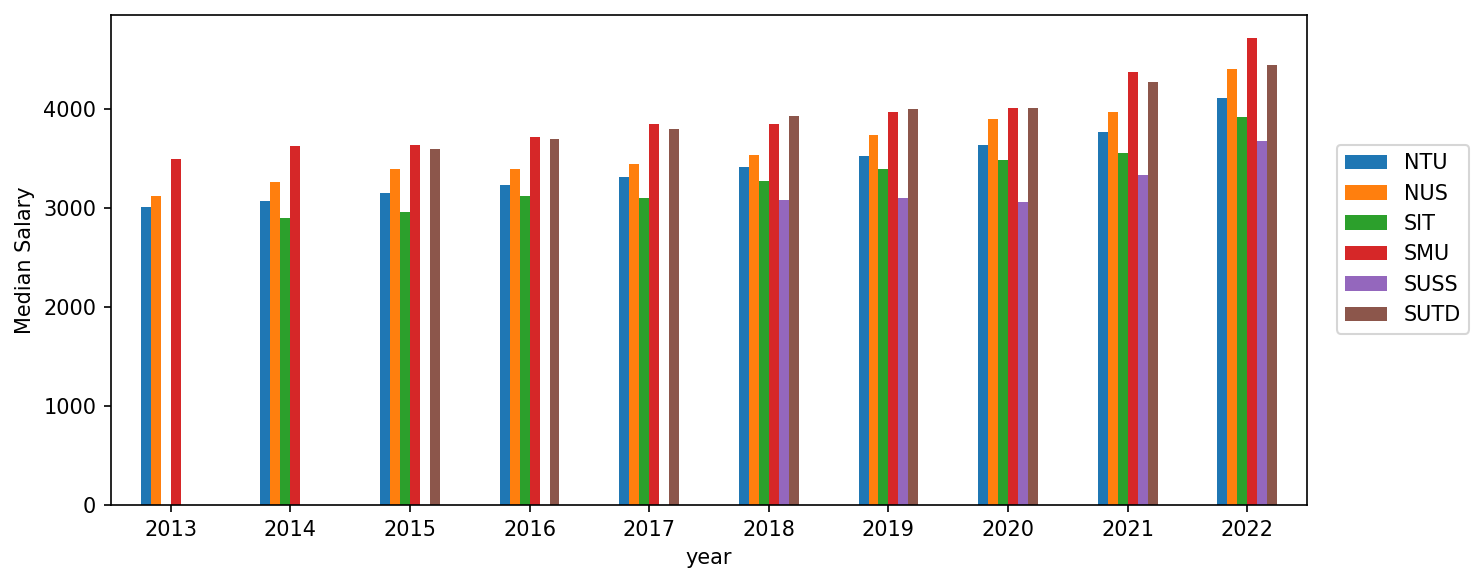
The Singapore government maintains and publicly shares various datasets at Data.gov.sg. In this question, we will analyse the median salaries of graduates from the different universities in Singapore.
You need Pandas
This question heavily utilises the package called Pandas. Pandas is the de facto package for all things related to data analysis. You must familiarise yourself (see the Knowledge Lake) with how to use Pandas to work on this problem.
Tasks
Download data
Download the data ‘Graduate Employment Survey - NTU, NUS, SIT, SMU & SUTD’ from the Data.gov.sg website.
Remember to read the descriptions of the data set so that you can know the data setup to your needs.
Read the data
Load the data into a Pandas dataframe. You might have to specify encoding='latin-1'
A quick peek
Quickly explore your dataset using the typical (e.g. info(), head(), shape) Pandas options.
Data Cleaning
Clean up the dataset by: 1. Shorter Names for the Universities 2. na replaced with np.nan 3. basic_monthly_median changed to type float.
Analyse the Data
Create a table of data that shows the minimum, maximum and mean for the basic_monthly_median as shown below.
Time to plot
Use the data you generated in the previous task to produce the plot shown above.
You might have to learn how to use the method pivot_table()