3.3 Simple plot with more details
#-------------- Lets create some data -------------#
x = [0,1,2,3,4,5]
y = [0,2,4,6,8,10]

#------------------- A quick plot -----------------#
plt.plot(x,y,color='r',marker='x',linestyle='--')
plt.xlabel('x values')
plt.ylabel('y values')
plt.title('My First Python Plot')
plt.grid()
plt.savefig('my-first-plot.png')
plt.show()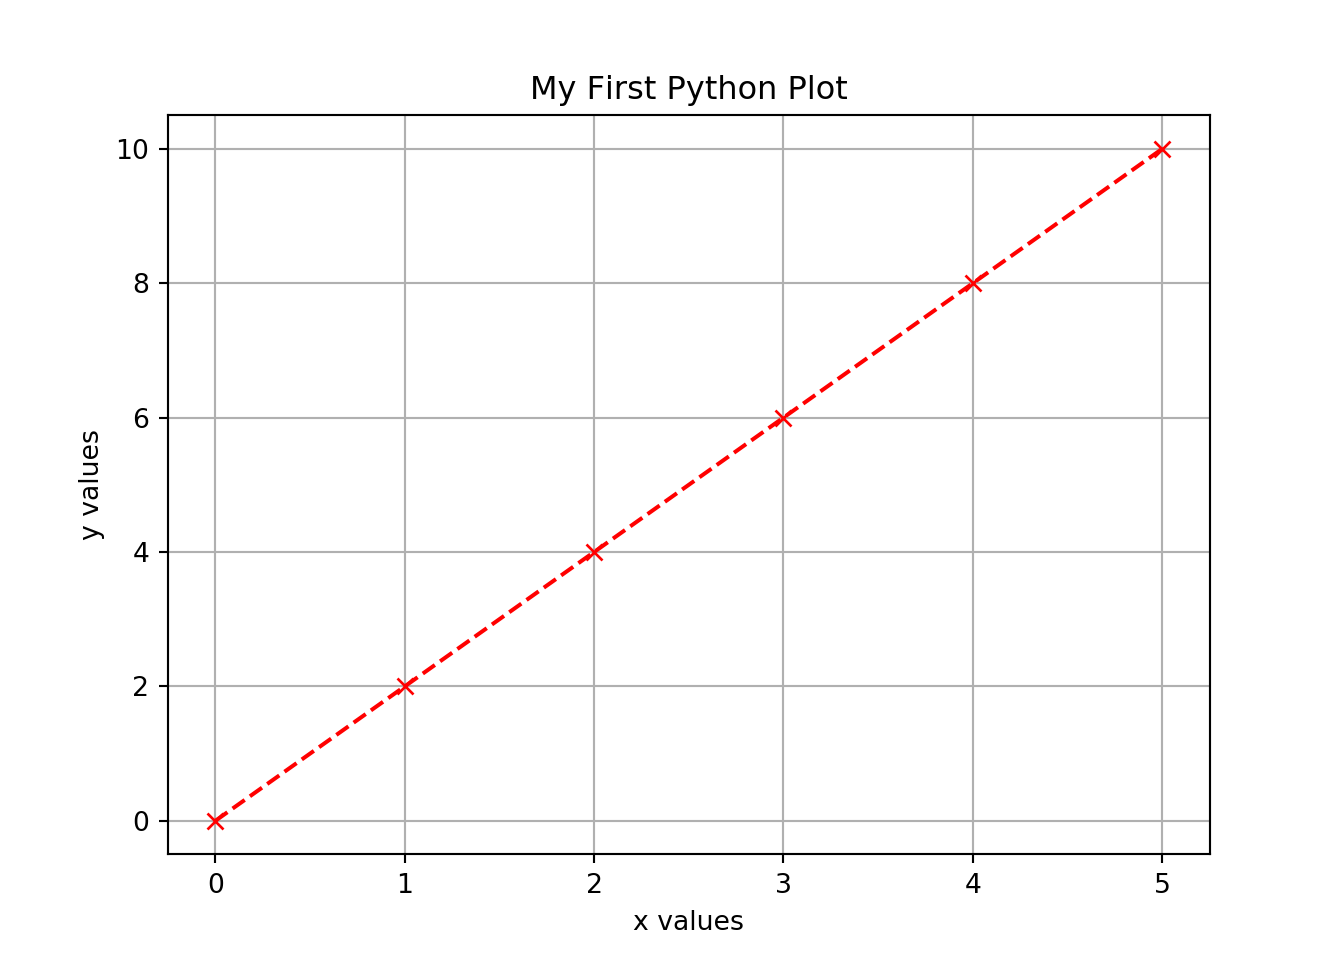
More options
Here are some more options for
linestyle.
Here are more options for
marker
