5.3 Anaylsing Image Dynamics
5.3.1 Starting simple: One frame
Lets calculate the total amount Red, Green and Blue in our first frame.
5.3.1.1 Version 1 (Lots of lines of code)
img = plt.imread('golgi-frame_01.tif')                         # Read the image in
img_no_noise =  img.copy()                                     # Make a copy

img_red = img_no_noise[:,:,0]                                  # Get the RED layer
img_green = img_no_noise[:,:,1]                                # Get the GREEN layer
img_blue = img_no_noise[:,:,2]                                 # Get the BLUE layer

#------------------ Remove noise ------------------ #
img_red[img_red < 25] = 0                                      # Remove noise in RED
img_green[img_green < 25] = 0                                  # Remove noise in GREEN
img_blue[img_blue < 25] = 0                                    # Remove noise in BLUE

#------------------ Get the TOTAL light ----------- #
total_red = img_red.sum()                                      # Total in RED
total_green = img_green.sum()                                  # Total in GREEN
total_blue = img_blue.sum()                                    # Total in BLUE

#------------------ Lets plot as a bar chart ------ #
data = [total_red,total_green,total_blue]                      # Put all the data together
plt.bar(['Red','Green','Blue'],data,color=['r','g','b'])
## <BarContainer object of 3 artists>
plt.show()
5.3.1.2 Version 2 (Simpler with loops)
img = plt.imread('golgi-frame_01.tif')                         # Read the image in
img_no_noise =  img.copy()                                     # Make a copy

data = []                                                      # Will will store our data here

for c in [0,1,2]:
 x =  img_no_noise[:,:,c]                                      # Pick the layer for the colour and call it x
 x[x < 25] = 0                                                 # Remove noise
 total = x.sum()                                               # Get the sum
 data.append(total)                                            # Add the value to the list

plt.bar(['Red','Green','Blue'],data,color=['r','g','b'])
## <BarContainer object of 3 artists>
plt.show()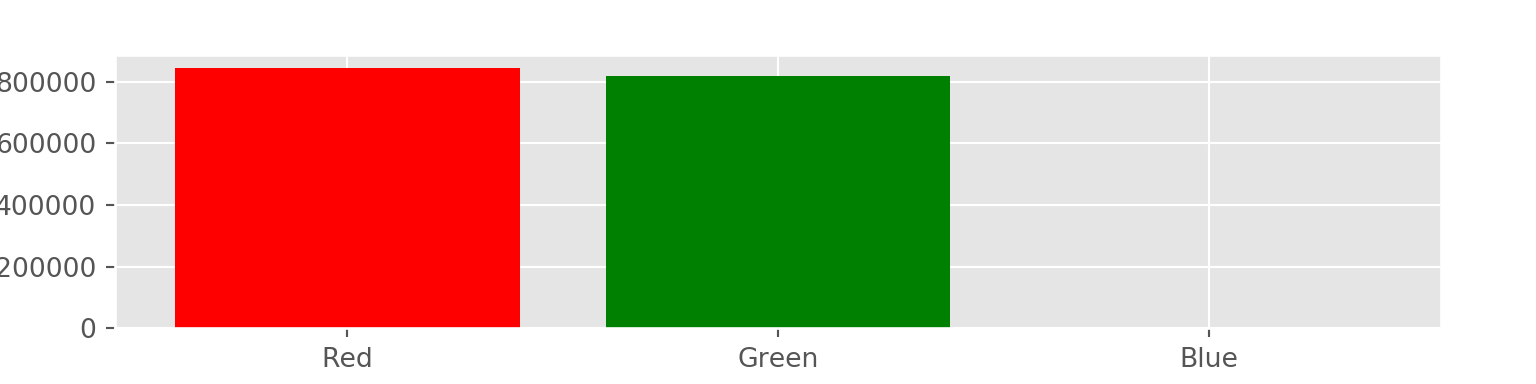
5.3.1.3 Version 3 (Lets use a function)
Lets define a function
def give_colours(filename):
  img = plt.imread(filename)                                     # Read the image
  img_no_noise =  img.copy()                                     # Make a copy
  data = []                                                      # Will will store our data here

#---- Go through all the colour layers using the loop------ #
  for c in [0,1,2]:
    x =  img_no_noise[:,:,c]                                      # Pick the layer for the colour and call it x
    x[x < 25] = 0                                                 # Remove noise
    data.append(x.sum())                                          # Add the value to the list

  return data                                                     # Give back the R,G,B totals
Lets use the function
data = give_colours('golgi-frame_01.tif')                          # Apply out function to the file 'golgi-frame_1.tif'
plt.bar(['Red','Green','Blue'],data,color=['r','g','b'])          # Plot!
## <BarContainer object of 3 artists>
plt.show()
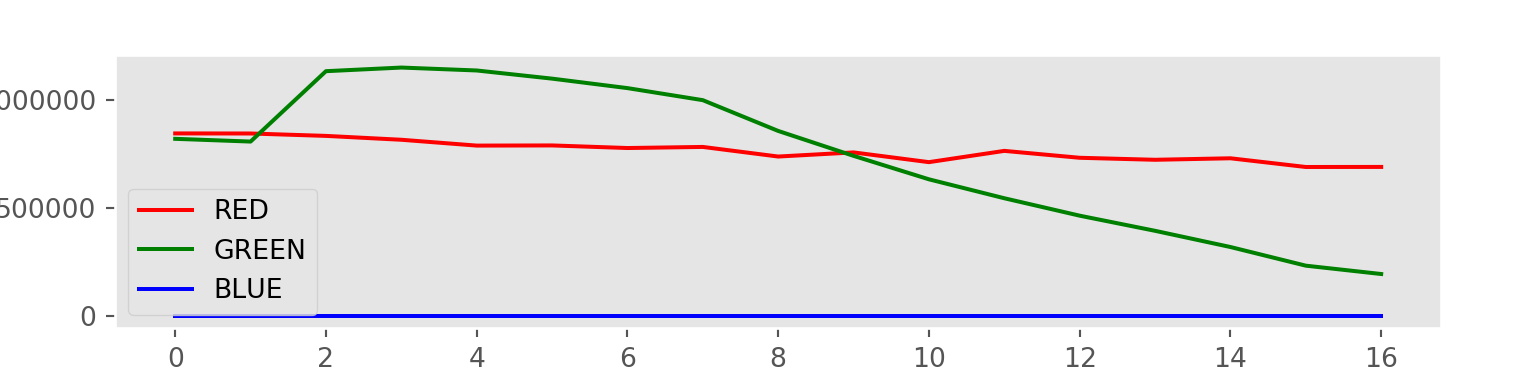
5.3.2 All frames
file_list = [
'golgi-frame_01.tif','golgi-frame_02.tif','golgi-frame_03.tif','golgi-frame_04.tif',
'golgi-frame_05.tif','golgi-frame_06.tif','golgi-frame_07.tif','golgi-frame_08.tif',
'golgi-frame_09.tif','golgi-frame_10.tif','golgi-frame_11.tif','golgi-frame_12.tif',
'golgi-frame_13.tif','golgi-frame_14.tif','golgi-frame_15.tif','golgi-frame_16.tif',
'golgi-frame_17.tif']

all_data = []                                     # To store ALL the data

for f in file_list:                               # Apply our function to all the frames
  x = give_colours(f)
  all_data.append(x)                              # Store the informatoin

all_data =  np.array(all_data)                    # Lets convert from a List to an Array. Why do we do this? Ask us :)

# Plot!
plt.plot(all_data[:,0],label='RED', color='r')
plt.plot(all_data[:,1],label='GREEN',color='g')
plt.plot(all_data[:,2],label='BLUE',color='b')
plt.grid()
plt.xlabel('Frame number (I.e. time)')
plt.ylabel('Intensity of colour')
plt.legend()
plt.show()