3.6 Plotting in style
You can use standard, optimised styles to plot. See here for the available styles.
plt.style.use('ggplot') # Use the 'ggplot' style
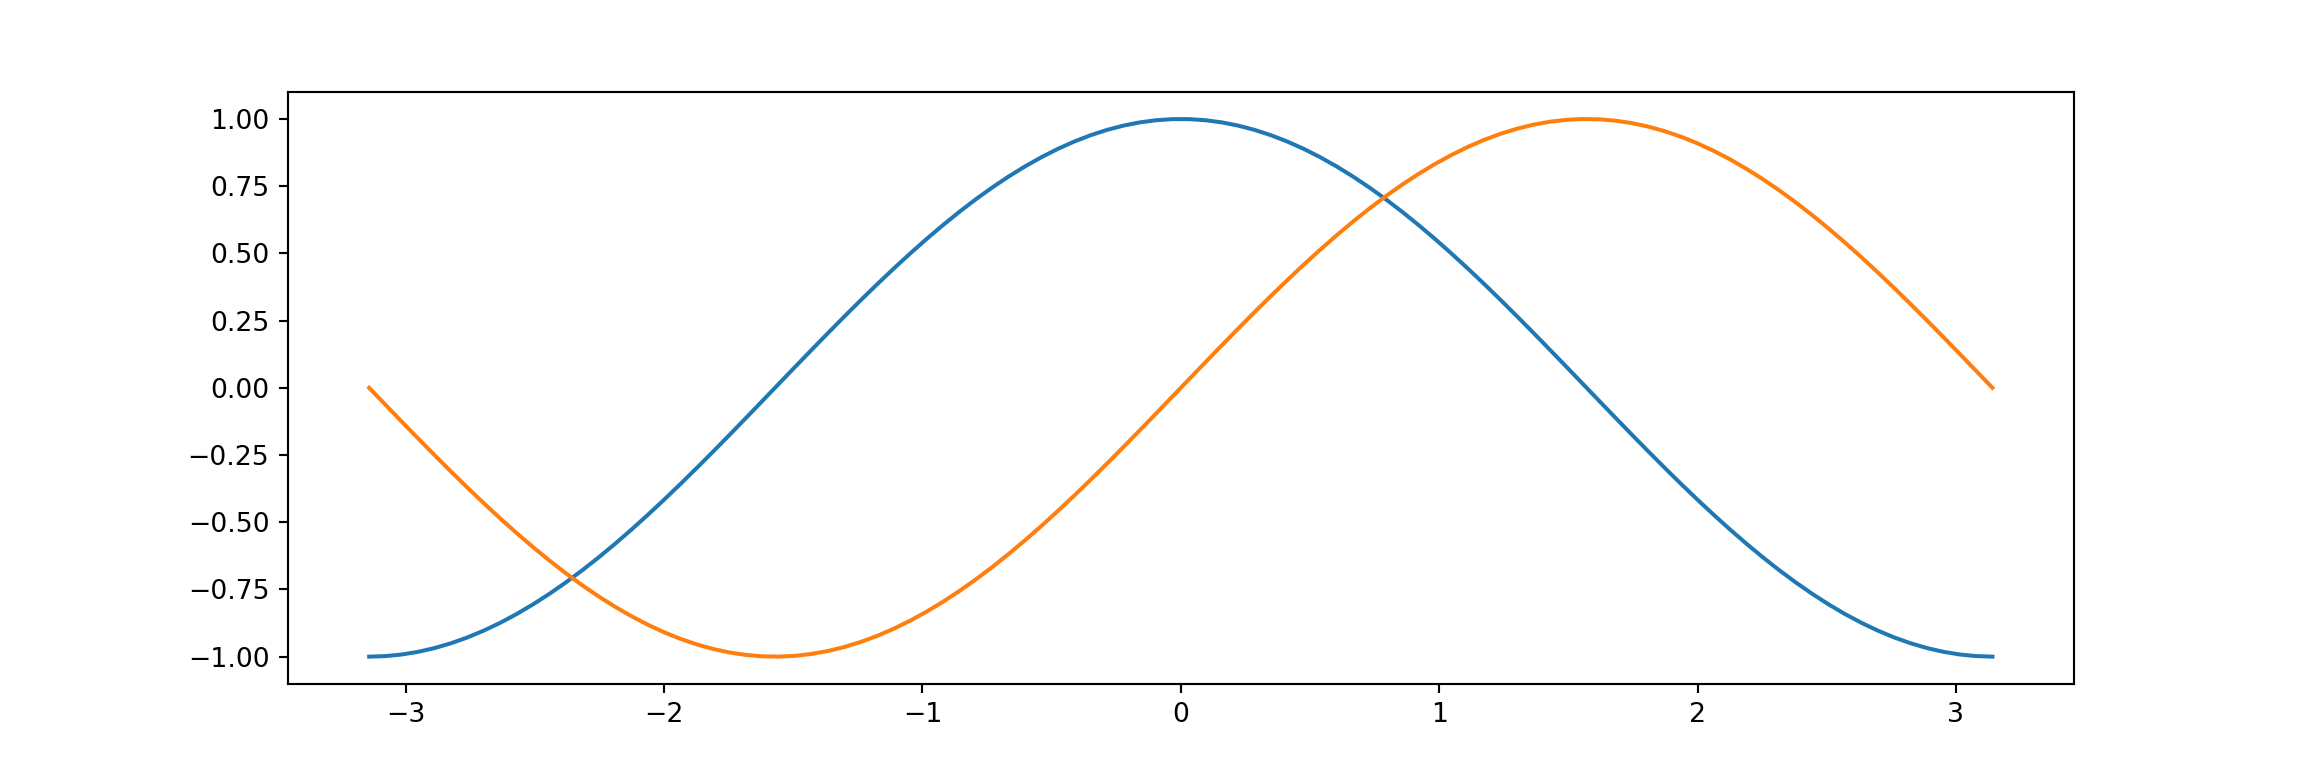
X = np.linspace(-np.pi, np.pi, num=100, endpoint=True)
C,S = np.cos(X), np.sin(X)
#------------------ Plot the data -----------------#
plt.plot(X,C)
plt.plot(X,S)
plt.show()