Exercise 4
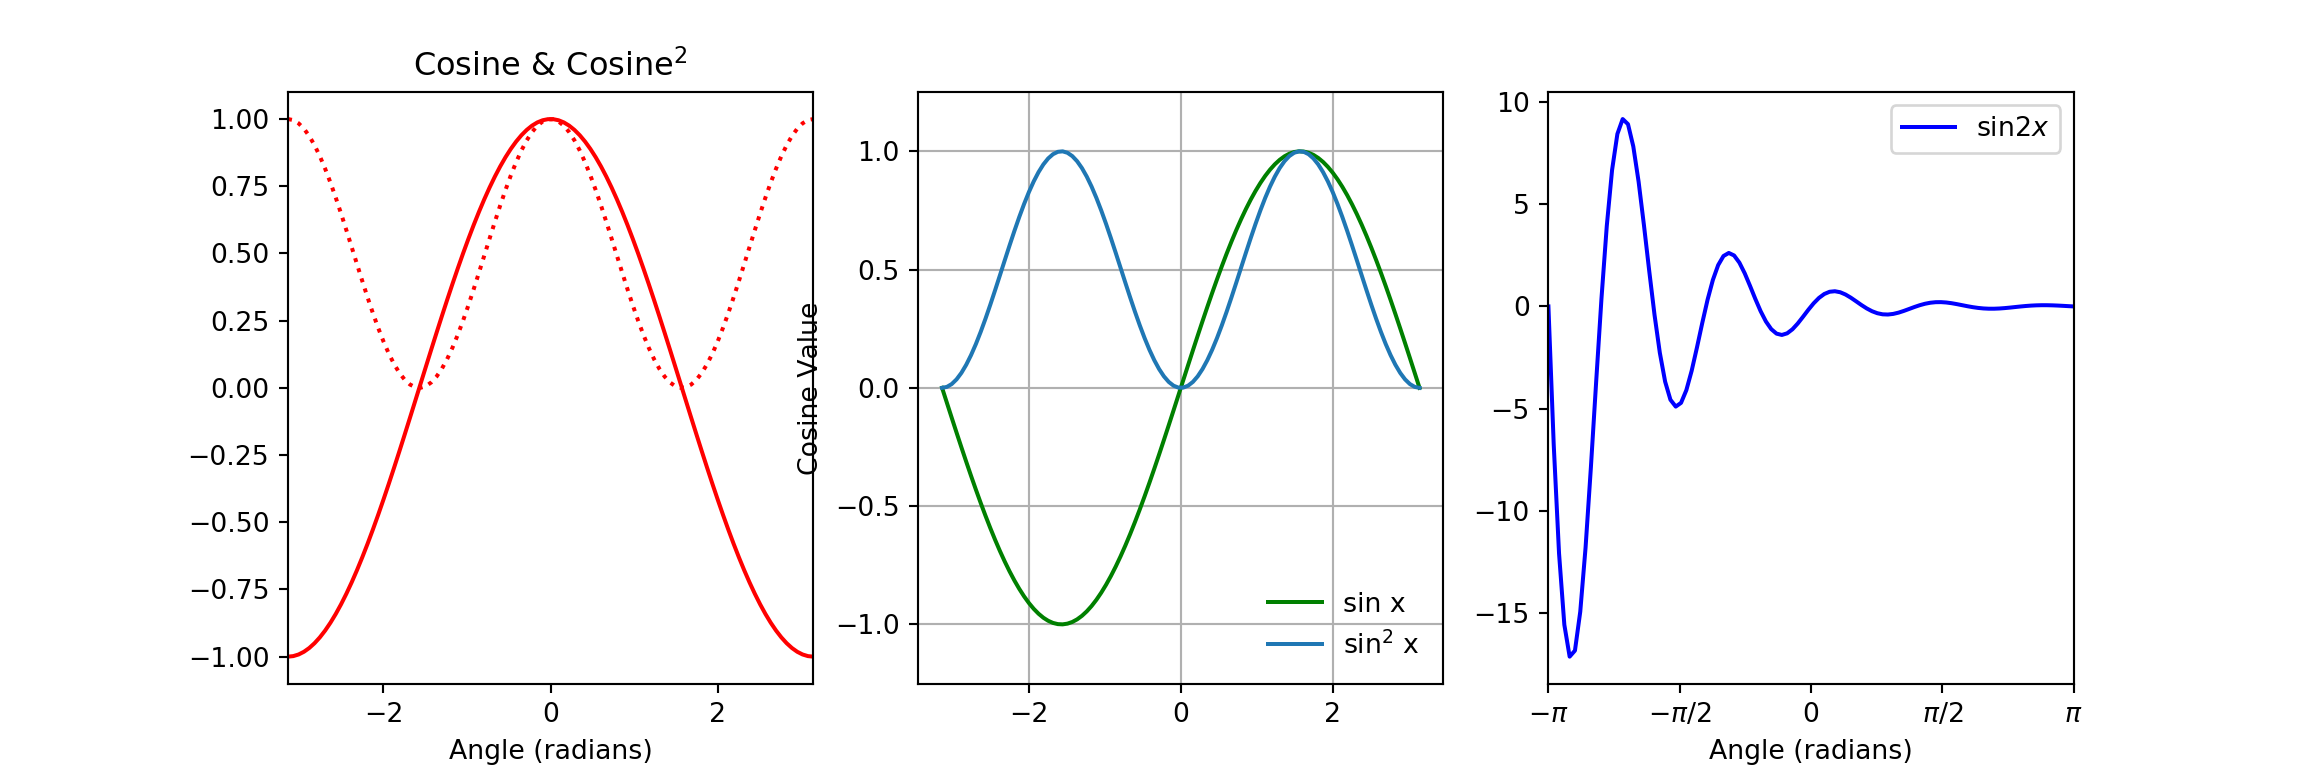
Shown below is code and the resulting plots. However, that the plots are not formatted consistently. Your job is to fix this formatting problem.
More specifically; go through the code and ‘fix’ the following:
- Make all the tick labels on the x-axes similar to that of the third subplot.
- Remove the title from the first subplot.
- Make the y range of the third subplot symmetrical.
- Correct the label of the third subplot.
- Add grids to all subplots.
- Add a legends to all subplots.
- See what the
plt.tight_layout()achieves.
X = np.linspace(-np.pi, np.pi, num=100, endpoint=True)

#--------- Generate cosine and sine values --------#
C = np.cos(X)
S = np.sin(X)
F = np.exp(-X)*np.sin(5*X)

#------------------ Plot the data -----------------#
plt.figure(figsize=(12,4));         # Figure size in inchs

#----------------------------------- Subplot 1 ----------------------------------#
plt.subplot(1,3,1)                            # 1 row, 3 columns
plt.plot(X,C,'r',label = 'cos x')
plt.plot(X,C**2,'r:',label = 'cos$^2$ x')
plt.title('Cosine & Cosine$^2$')
plt.xlabel('Angle (radians)')
plt.xlim(-np.pi,np.pi)

#----------------------------------- Subplot 2 ----------------------------------#
## (-3.141592653589793, 3.141592653589793)
plt.subplot(1,3,2)
plt.plot(X,S,'g',label = 'sin x')
plt.plot(X,S**2,label = 'sin$^2$ x')
plt.ylabel('Cosine Value')
plt.ylim(-1.25,1.25)
## (-1.25, 1.25)
plt.legend(loc = 'lower right',frameon = False)
plt.grid()

#----------------------------------- Subplot 3 ----------------------------------#
plt.subplot(1,3,3)
plt.plot(X,F,'b',label = '$\sin 2x$')
plt.xlabel('Angle (radians)')
plt.xlim(-np.pi,np.pi)
## (-3.141592653589793, 3.141592653589793)
plt.legend()
plt.xticks([-np.pi,-np.pi/2,0,np.pi/2,np.pi],['$-\pi$','$-\pi/2$','0','$\pi/2$','$\pi$'])

#plt.tight_layout()
## ([<matplotlib.axis.XTick object at 0x7f7aac84cc88>, <matplotlib.axis.XTick object at 0x7f7aac84c5c0>, <matplotlib.axis.XTick object at 0x7f7aac84c320>, <matplotlib.axis.XTick object at 0x7f7aac7f5f60>, <matplotlib.axis.XTick object at 0x7f7aac7fd470>], <a list of 5 Text xticklabel objects>)
plt.savefig('three-plots.png',dpi = 300,transparent = True)
plt.show()