Let There Be Light!
$$
$$

Image of the Pillars of Creation using the Hubble Space Telescope (left) and the James Webb Space Telescope, JWST (right). Hubble’s image uses visible light, while the JWST image uses near‑infrared light.
Nature, and Nature’s Laws, lay hid in Night.
God said, Let Newton be! and All was Light.
– Alexander Pope
Sunshine on my shoulders makes me happy
Sunshine in my eyes can make me cry
Sunshine on the water looks so lovely
Sunshine almost always makes me high
– John Denver, ‘Sunshine on My Shoulders’
What To Expect In This Chapter
The energy that sustains life on our planet originates from the Sun. This energy travels across the vast emptiness of space in the form of light. Once it arrives, light engages in a multitude of interactions. We rely on light for far more than vision. In science especially, light is a fundamental tool. Whether we look outward to the immense depths of space or inward to the tiniest atomic and cellular scales, most measurements involve light or waves. In this chapter, we will explore the nature of light and its remarkable properties. Along the way, we will uncover essential principles that can help you understand common and fascinating phenomena in the world around you.
1 What Is Light?
Let’s begin with a simple question: Why light? Why is it that energy from the Sun reaches us as light, rather than by some other means?
The answer lies in the fact that there are only three ways to transfer energy from one point to another: conduction, convection, and radiation1. Of these, only radiation (in this case, light) can cross the vast vacuum of space as both conduction and convection require a medium to operate.
Light is actually a wave (more specifically, an electromagnetic (EM) wave). A wave (such as those on the ocean) is a clever way to transfer energy from one place to another without transferring matter. We will explore waves in another chapter. For now, you can think of light as Nature’s elegant solution for sending energy across the emptiness of space.
2 Colours, Wavelengths And Wavenumbers
2.1 Colour And Wavelength

Let’s move on to another question: How many colours are there? For example, in the figure alongside, how many colours can you count in the rainbow? While we often say the rainbow has seven colours, in reality there are infinitely many shades. To describe colours more precisely (and scientifically), we use something called a wavelength (\(\lambda\)), usually measured in micrometres (\(\mu\text{m}\)) or nanometres (nm). In this system, a typical red might have a wavelength of about 665 nm, and a typical green about 550 nm. The term ‘wavelength’ comes from the wave nature of light we touched on earlier.
You will also encounter another way to specify colour: the wavenumber (\(\nu\), measured in cm\(^{-1}\)). Wavenumbers are widely used in spectroscopy. It is worth becoming comfortable with switching between wavelengths and wavenumbers.
Finally, frequency, measured in Hertz (Hz), is yet another way to “label” colours. However, wavelength (or wavenumber) is more commonly used, possibly because it is easier for most of us to relate to lengths than to rates of oscillation.
2.2 Wavenumber
The wavelength refers to a length (dah) and is measured in a unit of length (usually \(\mu\text{m}\) or nm). The wavenumber expresses the same information by giving the number of wavelengths that will fit into 1 cm.
Let’s take an example:
Example 1 (Wavelength To Wavenumber) How many wavenumbers is a wavelength of 500 nm?
Solution:
\(\lambda = 500\) nm means that a wavelength occupies a length of 500 nm. So the number of wavelengths in 1 metre is given by:
\[ \text{Number of wavelengths in 1 m} = \dfrac{1}{500}\dfrac{1}{\text{nm}} =\dfrac{10^{9}}{500} \dfrac{1}{\text{m}} \]
Let’s convert this to the number of wavelengths in 1 cm:
\[ \text{Number of wavelength in 1 cm} = \dfrac{10^{9}}{500} \dfrac{1}{\text{m}} = \dfrac{10^{9}}{500}\dfrac{10^{-2}}{\text{cm}} = 20,000 \text{ cm$^{-1}$} \]
Exercise 1 (Convert To Wavenumber)
What is the wavelength of an electromagnetic wave whose wavenumber is \(10,000\) cm-1?
3 The Electromagnetic Spectrum
3.1 What Is The EM Spectrum?

Note the top portion that indicates how the various wavelengths interact with our atmosphere.
Note also the bottom portion that shows the relationship to a blackbody.
It turns out that there are far more colours/wavelengths than our eyes can detect. The part we can see (called the visible range) is only a small portion of all possible electromagnetic (EM) waves. All of the other EM waves together form what we call the electromagnetic spectrum.
The different wavelengths and regions of the EM spectrum are shown in the figure above. You are probably already familiar with many parts of it from everyday life, for example, microwaves for cooking or X‑rays for medical imaging.
All the colours/wavelengths of the EM spectrum travel through empty space at the same speed (\(c\)). However, they have different characteristics. For example, as you will see later, different wavelengths carry different amounts of energy, with energy decreasing as wavelength increases.
The differences become even more obvious when EM waves interact with materials (such as glass or water). Different wavelengths travel at different speeds in a material and may be absorbed or transmitted to varying degrees. These differences have a huge impact on how we use and interact with light.
3.2 Typical Values
It is useful to remember a typical value of a wavelength that represent the various bands. I have shown this in the table below:
| Region of EM Spectrum | Wavelength Range | Typical Wavelength |
|---|---|---|
| Radio waves | > 10 cm | 1 m |
| Microwaves | 1 mm – 10 cm | 5 cm |
| Infrared (IR) | 700 nm – 1 mm | 10 μm |
| Visible light | 400 – 700 nm | 550 nm |
| Ultraviolet (UV) | 10 – 400 nm | 100 nm |
| X-rays | 0.01 – 10 nm | 1 nm |
| Gamma rays | < 0.01 nm | 0.001 nm |
It is also useful to remember some typical wavelengths within the visible range:
| Colour | Approximate Wavelength |
|---|---|
| Red | 650 nm |
| Green | 550 nm |
| Blue | 450 nm |
| Violet | 400 nm |
3.3 How Do We Create Light?

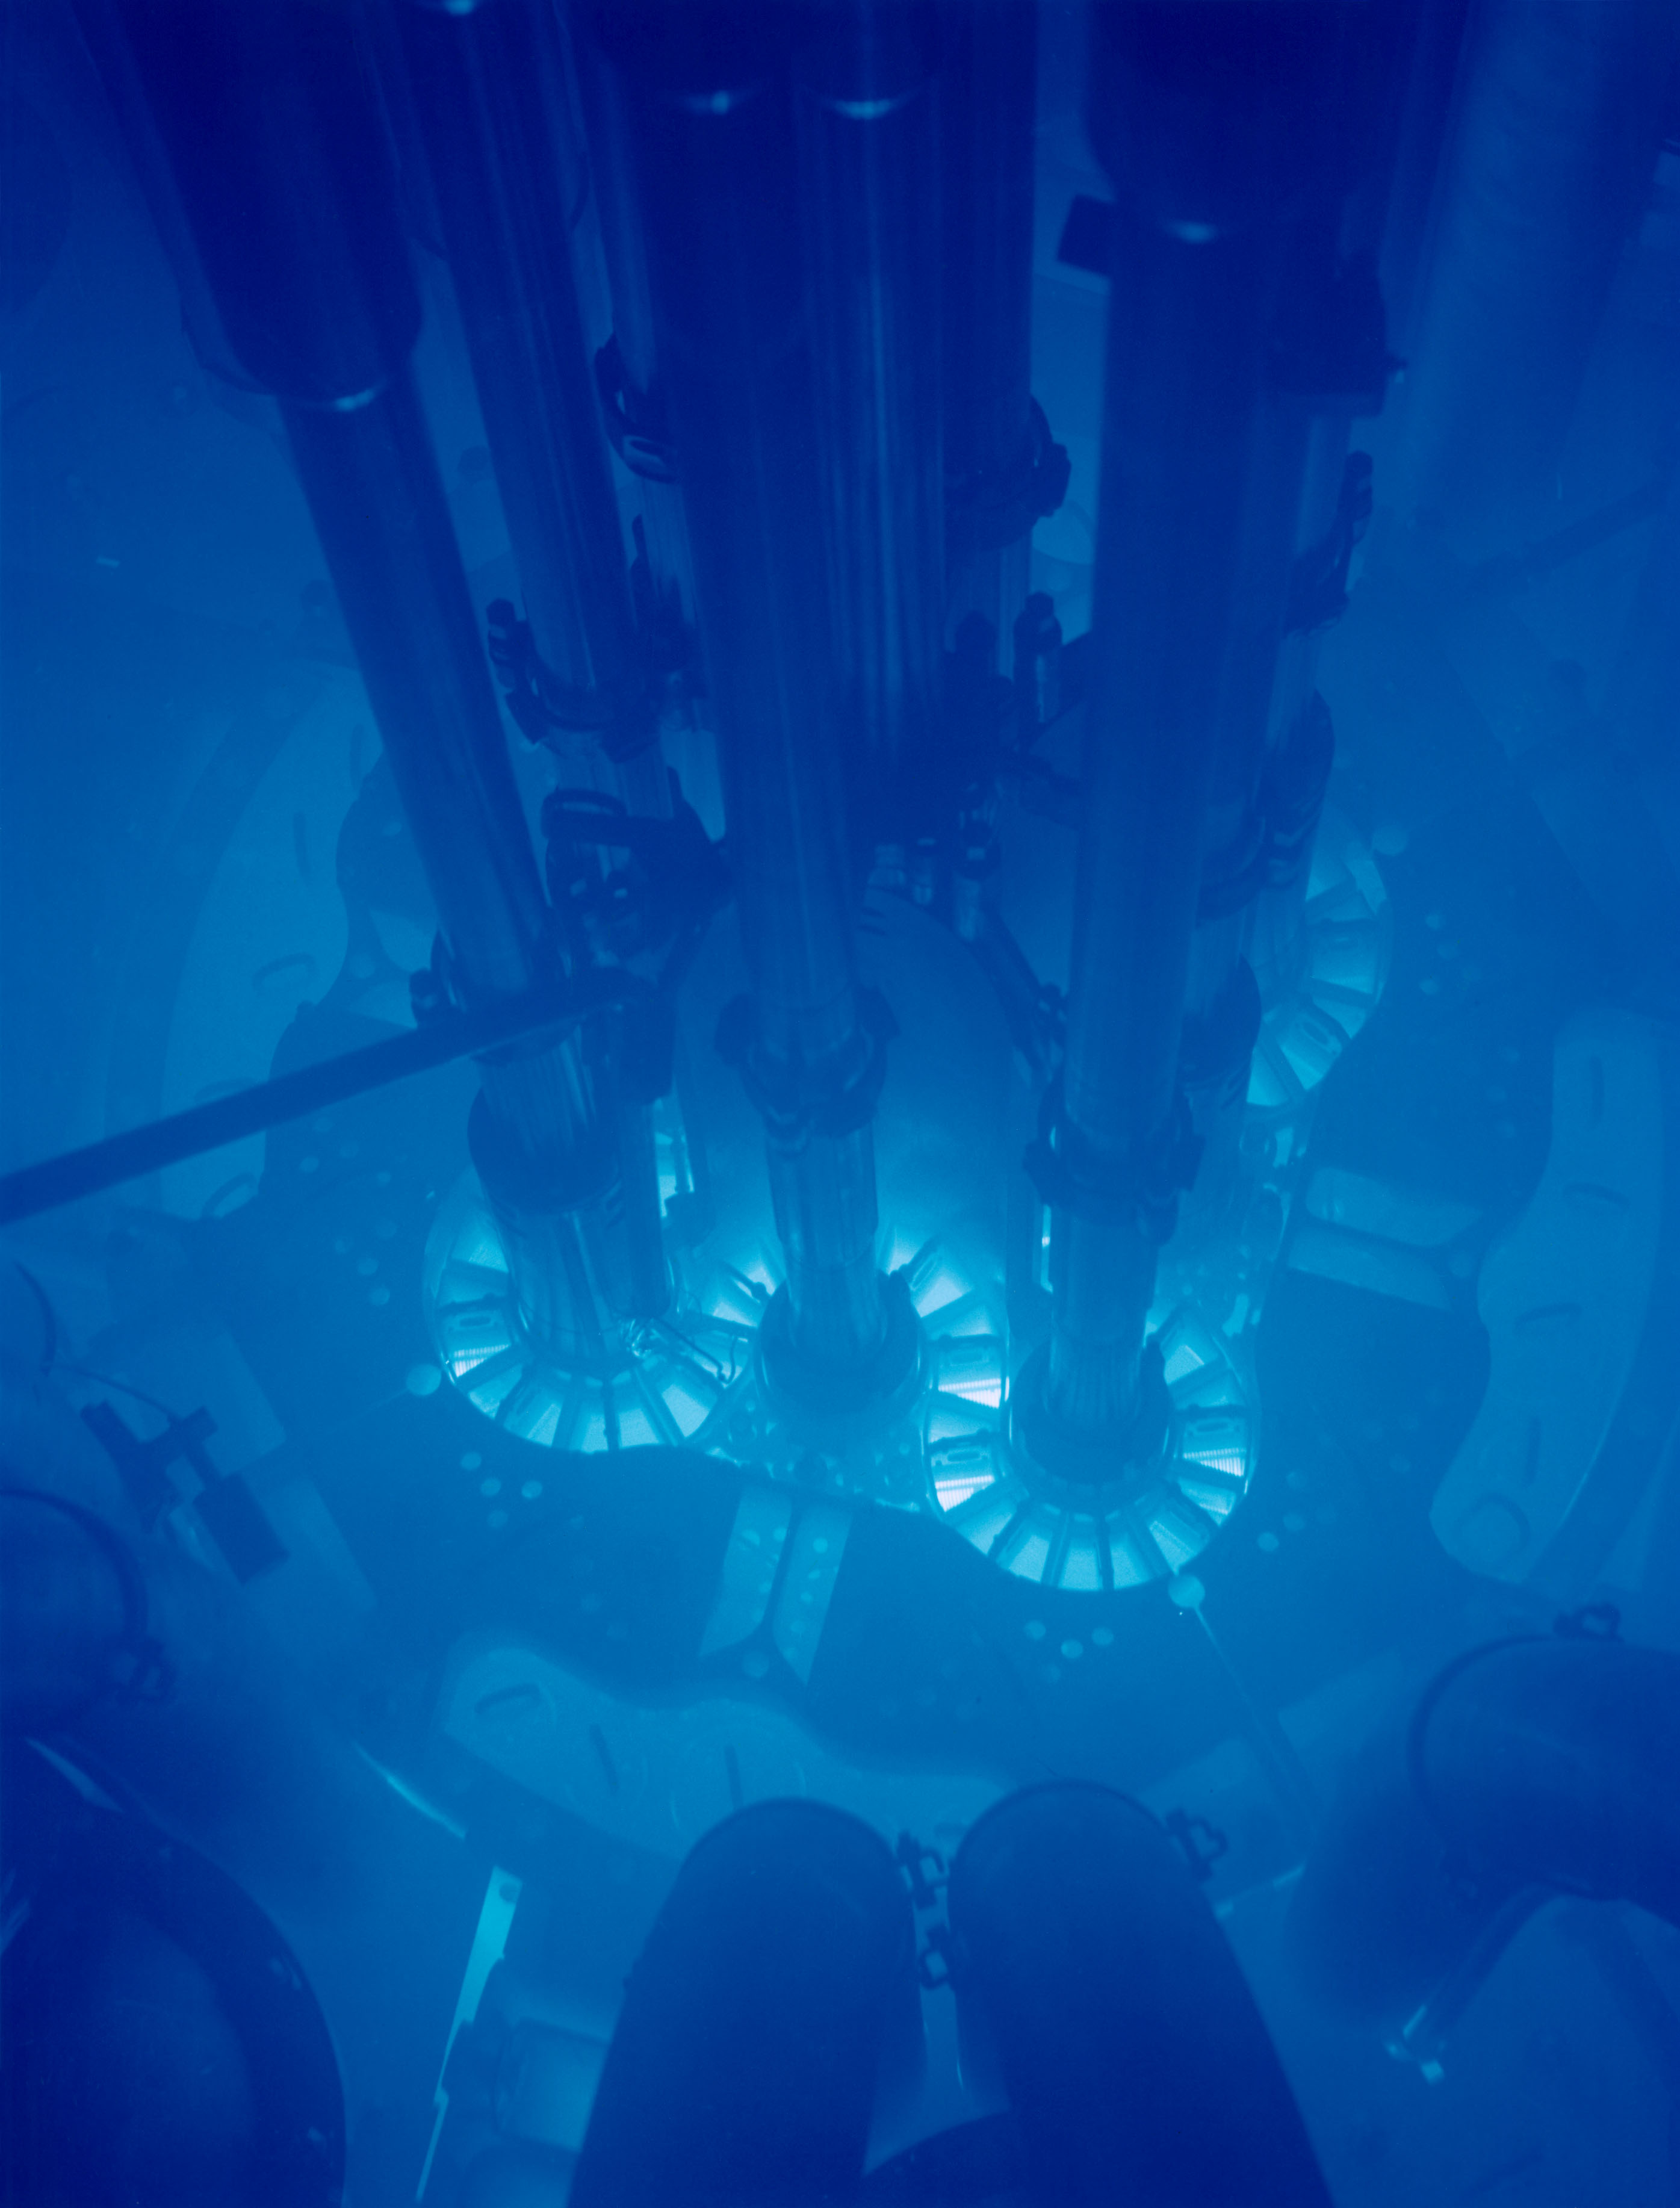
Many processes can produce light. Figure 4 shows two very different examples: one from a marine creature called a dinoflagellate, and another from a relativistic process known as Cherenkov radiation. Once light has been created, its properties are determined entirely by its wavelength2.
In general, different processes produce different combinations of wavelengths. For example, a LASER emits a very narrow range of wavelengths, while a black body (see Section 6) produces a much broader range. These combinations of wavelengths are perceived by our visual cortex as a single colour.
4 Light & Matter
To highlight how differently various colours and wavelengths interact with matter, let’s take the example of light in water.
The reason the ocean appears blue is because water is quite picky about colour. In fact, the reason microwaves work for cooking is also related to water molecules absorbing microwaves very effectively (try putting a dry, empty glass into a microwave and you will notice it does not heat up).
When I say picky, I mean that water is selective about how it absorbs different wavelengths. As shown in Table 3, red light is absorbed much more strongly than blue light. This means red penetrates the least, and blue penetrates the most. As a result, only blue light reaches the bottom and reflects back upwards.


We will talk more about this in a later chapter, but it is worth noting that no wavelength is ever completely absorbed. In fact, absorption typically follows an exponential decay as dictated by the Beer-Lambert Law.
5 The Light We See
5.1 The Light We See Is Not Pure

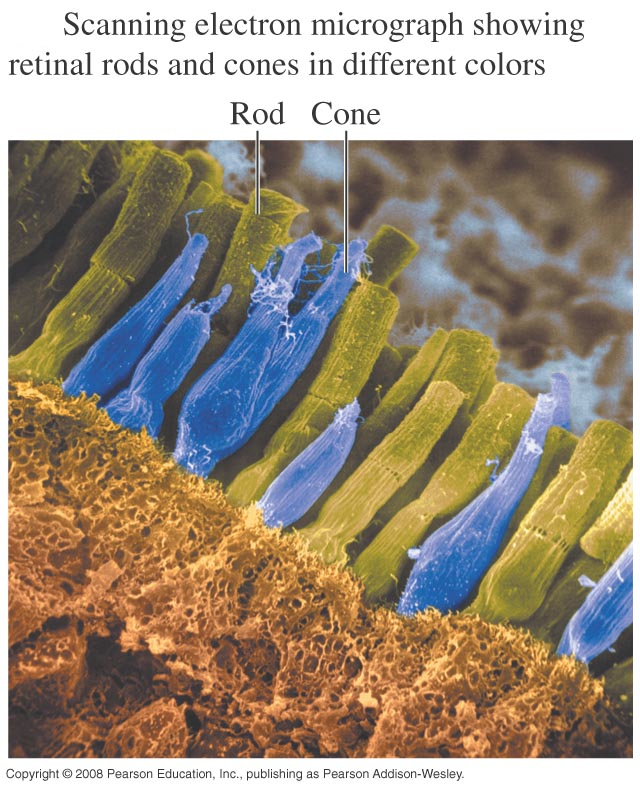
For us to experience light, it must first enter our eyes. The colours we perceive are usually a blend of many ‘pure’ wavelengths at different strengths (intensities). We detect these using the rod and cone structures in our eyes (Figure 5), each with its own characteristics.
For example, the soft white glow of a mercury lamp is actually made up of distinct colours such as blue, green, and orange, as shown in Figure 6.
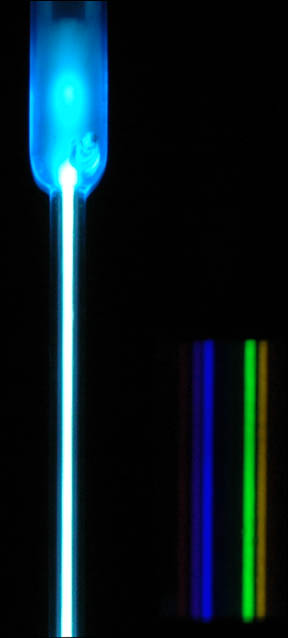
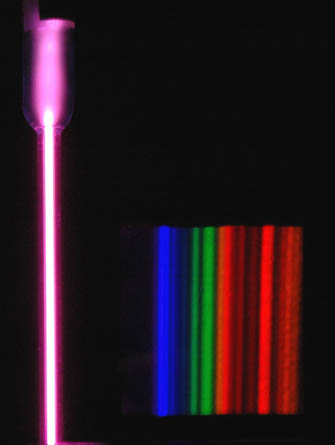
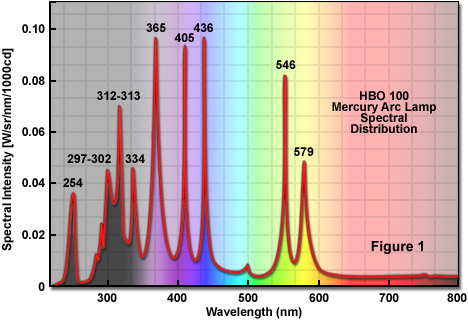
The full spectrum of mercury is shown below. (Source: Zeiss).
5.2 The Colour Of An Object
The colour of an object depends on how it reflects, absorbs, transmits, and emits light. Shown in Figure 7 is an ancient yet fantastic example of colours being different in transmission and reflection.
- Reflection: If an object only reflects light, its appearance depends on the spectrum of the light source. An object appears a certain colour in reflection because it absorbs all wavelengths except the one reflected. For example, a red apple looks red because it reflects red wavelengths and absorbs most others.
- Absorption: The energy absorbed by a material can be used in other processes, such as fluorescence (e.g., the glow from highlighter ink under UV light), or can contribute to heating the material (e.g., sunlight warming a dark surface).
- Emission: Materials can also produce their own light through several processes. For our purposes, the most relevant are atomic emission, fluorescence, and blackbody radiation. The first two involve the release of stored energy after being excited, while the colour of a blackbody depends solely on the object’s temperature (see Section 6).
- Transmission: Some objects allow certain wavelengths to pass through while absorbing others (e.g., coloured glass).


(Source British Museum)
6 Light From Heat & The Blackbody
6.1 Everybody Is Glowing
All objects with a temperature above absolute zero emit electromagnetic (EM) waves. In addition to the furnace shown in Figure 8, other good examples include the Sun, red-hot lava, the filament of a bulb, and you! This idea of radiation related to temperature is also the basis of the thermal images that were ubiquitous during the COVID-19 pandemic.
A useful way to understand the phenomenon of emission of EM radiation from hot bodies is to use the concept of a Blackbody.

6.2 The Spectrum Of A Blackbody
The emission spectrum of a blackbody depends only on its absolute temperature.
Figure 9 is an interactive simulation from PhET Interactive Simulations (2025) that shows how temperature changes the emission spectrum and how the blackbody will appear to the human eye. Notice how there is energy emitted at all wavelengths.
6.3 Planck’s Radiation Law
The shape of the blackbody spectrum, also known as the blackbody curve, is described by Planck’s law shown below. \[ B_\lambda(\lambda,T) = \dfrac{2 h c^2}{\lambda^5} \frac{1}{\exp\left(\dfrac{h c}{\lambda}/k_B T\right) - 1} \tag{1}\]
| Planck’s constant (\(h\)) | 6.626 × 10⁻³⁴ | Js |
| Speed of light (\(c\)) | 2.998 × 10⁸ | m/s |
| Boltzmann’s constant (\(k_B\)) | 1.381 × 10⁻²³ | J/K |
| Wavelength (\(λ\)) | m | |
| Absolute temperature (\(T\)) | K |
This function should be understood as3. \[ B_\lambda(T)d\lambda = \text{total intensity of emitted radiation due to the wavelengths in the interval } [\lambda,\lambda + d\lambda] \]
Note: Max Planck had to introduce the radical idea that light exists in discrete packets (or quanta) of energy, which allowed him to derive this equation from first principles. Planck’s work is considered the beginning of a new era in physics and marked the birth of quantum mechanics. This was later followed by Albert Einstein, who, in his explanation of the photoelectric effect, gave EM waves a particle-like nature by introducing the photon as the quantum of EM energy.
6.4 Properties Of Blackbodies
Colour
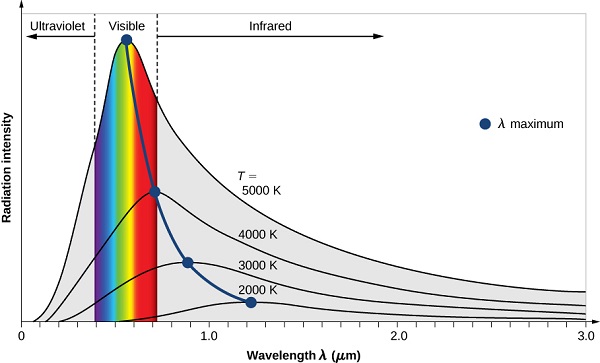
A blackbody is called ‘black’ because it absorbs all the light that falls on it. However, since a blackbody also emits EM energy, it will not actually appear black. The spectrum of wavelengths it emits depends only on its temperature. Figure 10 shows the emission spectra of a blackbody at three different temperatures.
Total Intensity
We can calculate the total intensity emitted by a blackbody (represented by the area under the curve) by integrating Planck’s function over all wavelengths. This gives the (very, very useful) Stefan-Boltzmann Law.
Peak Emission
The location of the peak of the blackbody spectrum is important because it indicates the wavelength at which the emission is most intense. This peak is given by Wien’s Displacement Law. The position of the peak can also be determined mathematically by differentiating Planck’s law (Equation 1).
6.5 Corollary: Good & Bad Emitters
A good absorber of radiation is also a good emitter, and a poor absorber is a poor emitter. This follows directly from the laws of thermodynamics: if it were not true, two objects at the same temperature could transfer energy from one to the other!
For example:
- A surface painted matte black is a strong absorber of visible light and is also an efficient emitter of thermal radiation.
- A shiny, polished metal surface reflects most incoming light, making it a poor absorber and a poor emitter.
6.6 When Black is Grey
In reality, most objects are not perfect blackbodies, and their emission spectra do not match Planck’s law exactly (see Figure 11). Such objects are referred to as grey bodies.
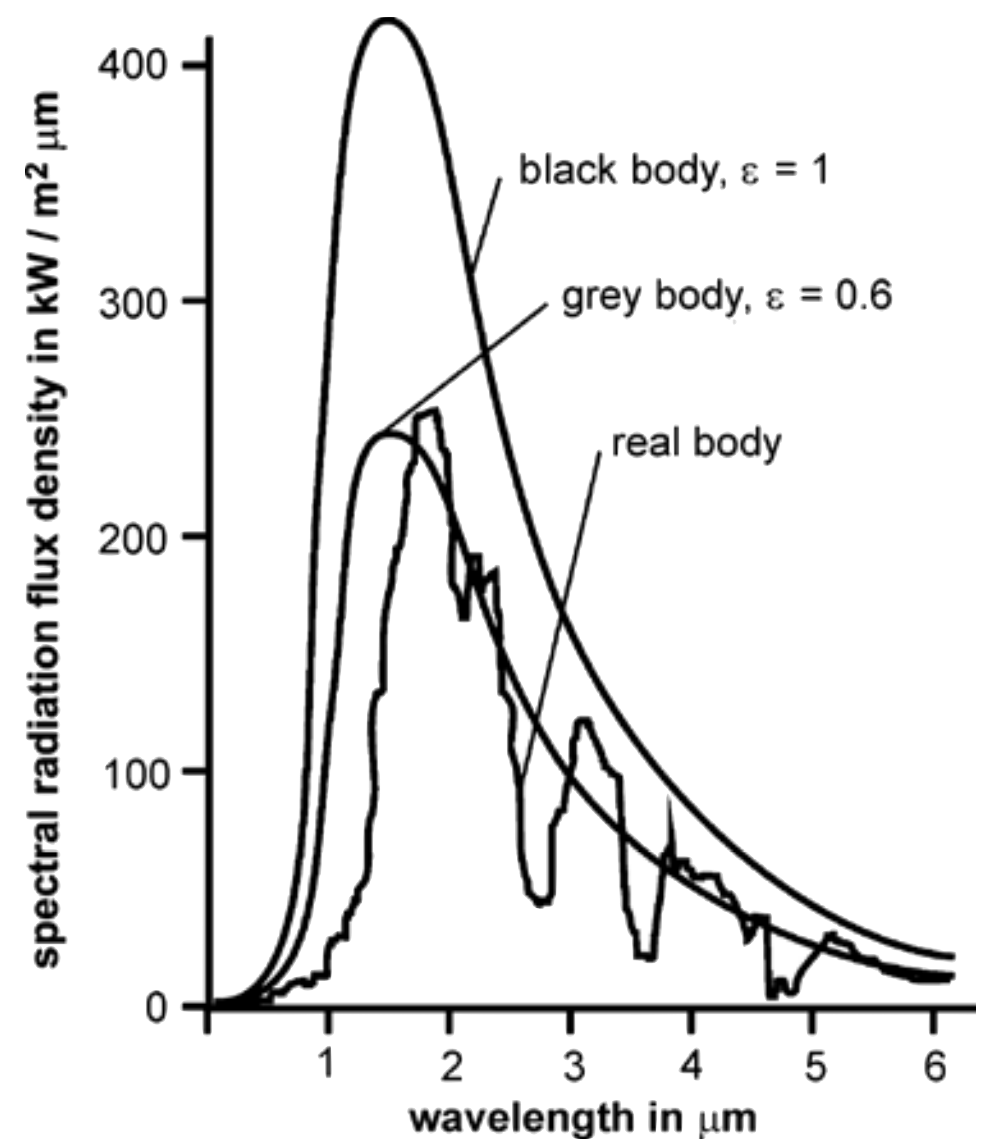
For a grey body, we introduce a corrective factor called the emissivity \(\epsilon\) into the Stefan–Boltzmann law. Emissivity is a number between 0 and 1 that represents how efficiently a surface emits radiation compared to an ideal blackbody at the same temperature.
The Stefan–Boltzmann law for a grey body is:
\[ I = \epsilon \, \sigma T^4 \tag{4}\]
Although emissivity can vary with wavelength, in many practical situations we use a single average value for simplicity. The table below shows typical emissivity values for some common materials.
| Material | Emissivity (%) |
|---|---|
| Water | 92–96 |
| Fresh, dry snow | 82–99.5 |
| Ice | 96 |
| Sand, dry | 84–90 |
| Soil, moist | 95–98 |
| Soil, dry plowed | 90 |
| Desert | 90–91 |
| Forest and shrubs | 90 |
| Skin, human | 95 |
| Concrete | 71–88 |
| Polished aluminium | 1–5 |
7 Atomic Emission
7.1 A Quick Summary Of The Atom
We have been speculating about the nature of atoms for thousands of years. The current model based on quantum mechanics describes atoms in terms of orbitals and energy levels. This more sophisticated model builds on the pioneering models of Rutherford and Bohr.
In this quantum picture, the atom consists of a dense, positively charged core made up of protons and neutrons, with electrons occupying regions around it in various energy levels. Every atom of each element has a unique arrangement of electron energy levels.
Electrons can be excited into unoccupied energy levels by providing energy (for example, by absorbing light, passing an electric current , or heating it in a flame). When the electrons return to their original (lower-energy) states, the surplus energy is released as packets of light called a photon. The colours you see when an atom is excited (as in a flame test) are a direct result of this process. Figure 12 shows light emitted from atomic discharge tubes, where atoms are excited by an electric discharge.


7.2 Atomic Spectra
A remarkable feature of this atomic light is that each element emits a unique combination of wavelengths, known as its emission line spectrum (see Figure 13). This spectrum acts like an atomic fingerprint, allowing us to identify the presence of specific elements for example, in interstellar gas clouds.
The simplest emission spectrum is that of hydrogen, which we will examine in detail later.
8 Light As Particles
Although we initially thought of light as a wave, it was later discovered (see the Photoelectric Effect) that under certain conditions, light behaves like particles. This wave-particle duality is now firmly established and forms the basis of quantum mechanics, which is our tool to understand the atomic domain. We call a particle of light a photon. The energy carried by a photon is given by
\[ E=\dfrac{hc}{\lambda} \tag{5}\]
If you consider Equation 5 for the energy of a photon, you will notice that a red photon carries less energy than a violet photon. In general, the energy carried by an EM wavelength decreases with increasing wavelength.
9 Diffraction Grating
As we have discussed before, the various wavelengths contained in a signal can carry important information. A diffraction grating is a simple yet powerful instrument that allows us to separate light into its component wavelengths.
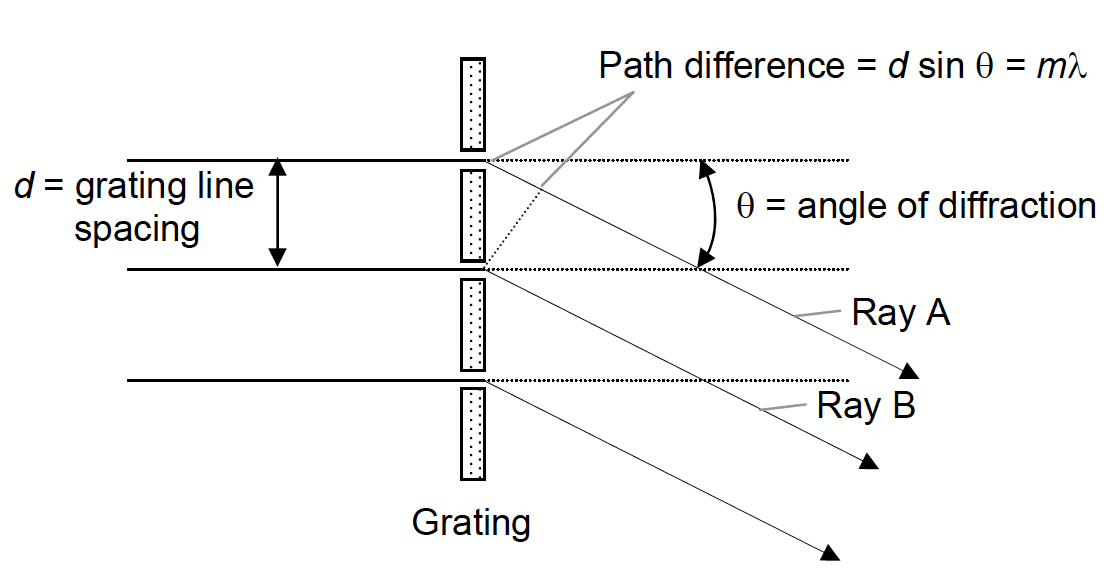
A diffraction grating is a piece of transparent material on which a large number of equally spaced, parallel lines have been ruled. The distance between these lines is called the grating line spacing, \(d\).

(Right) A diffraction grating at 100× magnification. The width of the transparent portion is 785 nm, with a total period of 1666 nm.
When light strikes the grating, it is diffracted by the parallel lines, producing beams that emerge at various angles relative to the incident beam. If the diffracted rays from adjacent lines interfere constructively (that is, they are in phase), a bright image of the source is formed. We will discuss the meaning of these terms in more detail and derive Equation 6 in a later chapter.
The working of a diffraction grating is described by the following grating equation:
\[ d \sin\theta = m\lambda \tag{6}\]
| \(m\) | Diffraction order (\(0, 1, 2, \ldots\)) | |
| \(\lambda\) | Wavelength of light | m |
| \(d\) | Grating line spacing | m |
| \(\theta\) | Diffraction angle | rad |
References
Footnotes
The term radiation refers to anything that carries energy away from its source. It is used for light, but also for nuclear processes, because both involve energy being carried away.↩︎
There is also a property called polarisation that is important, but we will not worry about that for now.↩︎
\(B(\lambda)\) is called the spectral radiance and is slightly more complicated to use than I am letting on.↩︎