4 Image Dynamics
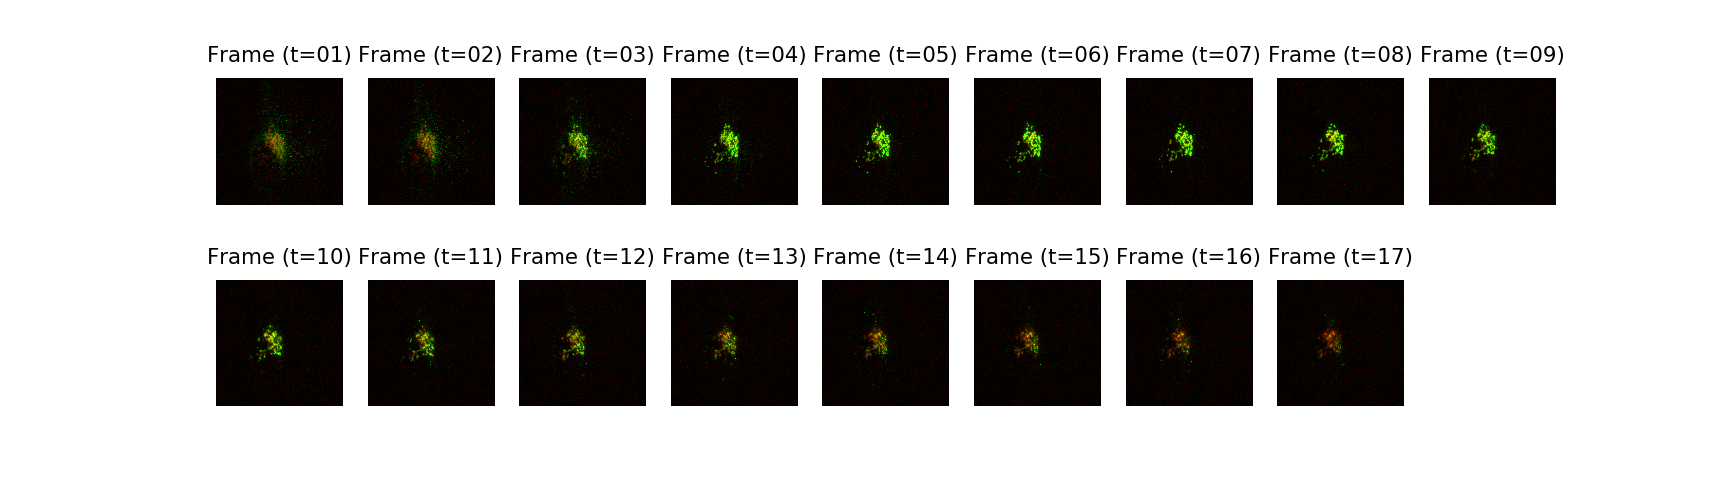
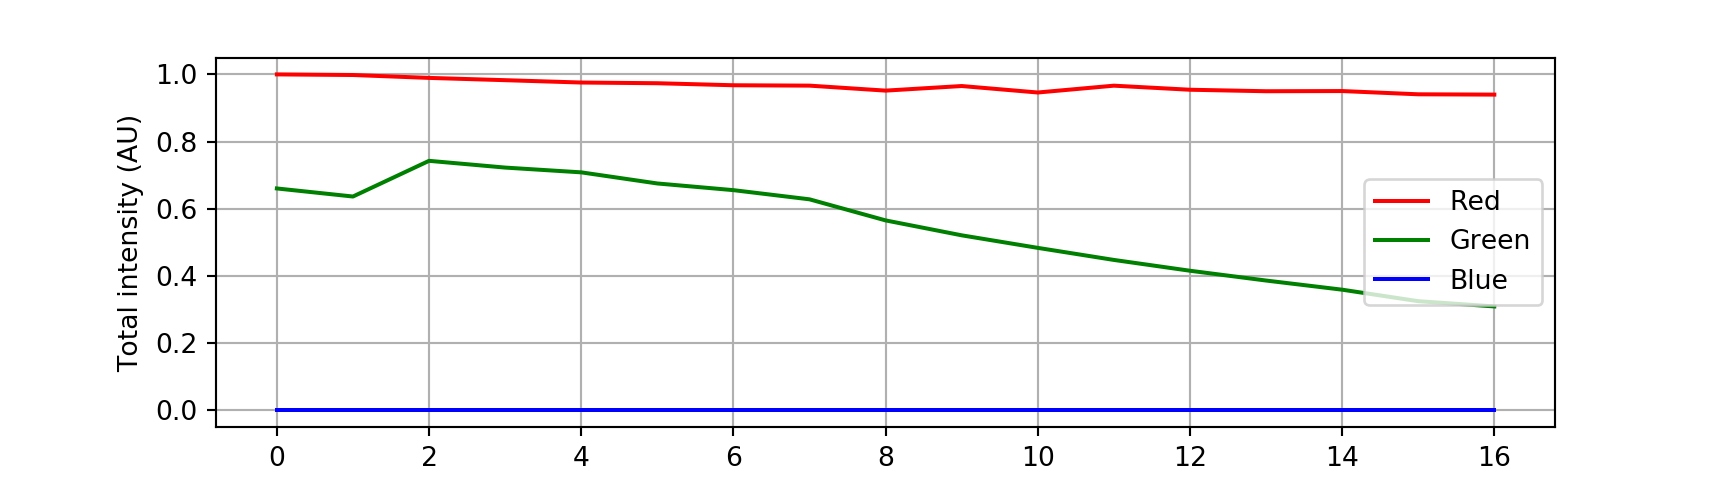
In this section we will use the power of Python to visualise the dynamics of a cell. Specifically, we will quantify the amount of cargo protein (stained by GPF-TNF, i.e. GREEN) in the Golgi area (stained by mCherry- ManII, i.e. RED) as a function of time.
This file contains time lapse images of how the cargo protein moves into and out of the golgi area. There are 17 frames. What we want to do is quantify the variationof cargo protein in the golgi region with time.