5.2 Image Basics
- Please upload the file ‘four-circles.jpg’ into Colab before you do the following.
View \(\longrightarrow\) Table of Contents \(\longrightarrow\) Files \(\longrightarrow\) UPLOAD
Consider the following example.
import matplotlib.pyplot as plt

img = plt.imread('./four-circles.jpg')    # Load the image
plt.imshow(img)                           # Display the image
plt.axis('off')                           # Don't show the axes
## (-0.5, 999.5, 999.5, -0.5)
plt.show()
print(img.shape)                  # What type of variabe is 'img'
## (1000, 1000, 3)
Note that:
- The image is stored as a \(1000 \times 1000 \times 3\), np array!
- The image is actually \(3\) stacked np \(1000 \times 1000\) arrays.
Each of these arrays carry information about the RGB (red, green, blue) components (‘channels’) - We can check this by just visualizing the ‘layers’ separately.
5.2.1 Images Layers
Lets see how the data in the image four-circles.jpg is stored. Then plot the original image along with the three RGB layers as shown below.
img = plt.imread('./four-circles.jpg')
plt.figure(figsize=(8,2))

#----------------- Display the original image ---------------#
plt.subplot(1,4,1)
plt.imshow(img)
plt.title('Original (RGB)')
plt.axis('off')

#------------------ Display the RGB channels ----------------#

#------------------ Red channel ------------------- #
## (-0.5, 999.5, 999.5, -0.5)
plt.subplot(1,4,2)
plt.imshow(img[:,:,0],cmap='gray')                  # ALL row & ALL columns of the layer
plt.title('Red' + ' Channel (Gray)')
plt.axis('off')

#------------------ Green channel ------------------- #
## (-0.5, 999.5, 999.5, -0.5)
plt.subplot(1,4,3)
plt.imshow(img[:,:,1],cmap='gray')                  # ALL row & ALL columns of the layer
plt.title('Green' + ' Channel (Gray)')
plt.axis('off')

#------------------ Blue channel ------------------- #
## (-0.5, 999.5, 999.5, -0.5)
plt.subplot(1,4,4)
plt.imshow(img[:,:,2],cmap='gray')                  # ALL row & ALL columns of the layer
plt.title('Blue' + ' Channel (Gray)')
plt.axis('off')

## (-0.5, 999.5, 999.5, -0.5)
plt.tight_layout()
plt.show()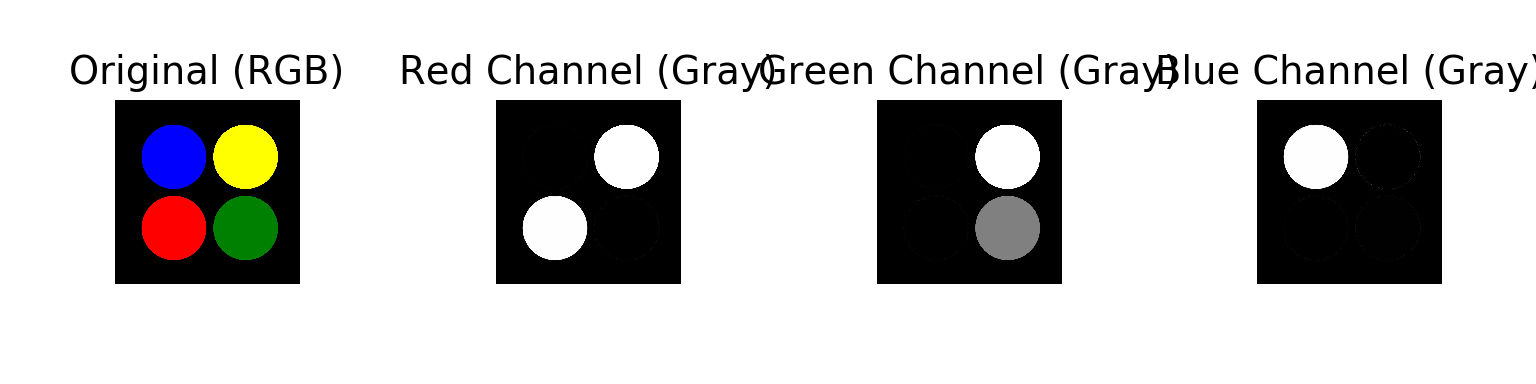
Note that:
- For the red channel, we cannot see the green and blue circles. But, we can still see the yellow as you need some red (and green) to make yellow.
- For the green channel, we cannot see the red and blue circles. But, we can still see the yellow as you need some green (and red) to make yellow.
- For the blue channel, we cannot see the red and green circles. The yellow circle is also not visible. You don’t need blue to make yellow.
5.2.2 Is the backgrond really black?
- Please upload the file ‘background.tif’ into Colab before you do the following. View \(\longrightarrow\) Table of Contents \(\longrightarrow\) Files \(\longrightarrow\) UPLOAD
There is a very interesting phenomenon called noise that we need to understand. For this lets take a look at the file background.tif
Check if there is noise
img = plt.imread('./background.tif')
plt.imshow(img)
plt.axis('off')
## (-0.5, 511.5, 511.5, -0.5)
plt.show()
Although this image looks black, is it really full of zeros?
Lets check.
img.shape # What is the shape?## (512, 512, 3)img.min() # What is the minimum number?## 0img.max() # What is the maximum number?## 28img.mean() # What is the mean number?## 4.996832529703776img.sum() # What is the total?## 3929669Remove noise
These small valuses that are just random is called noise. In imaging processing it is good to remove noise before doing any quantitative work. We can do this by:
img_no_noise =  img.copy()                    # Make a copy
img_no_noise[img_no_noise < 25] = 0           # Make all values less that 25 zero

img_no_noise.shape                           # What is the shape?
## (512, 512, 3)
img_no_noise.min()                           # What is the minimum number?
## 0
img_no_noise.max()                           # What is the maximum number?
## 28
img_no_noise.mean()                          # What is the mean number?
## 0.0007184346516927084
img_no_noise.sum()                           # What is the total?
## 565
Notice how the mean and sum are very small.