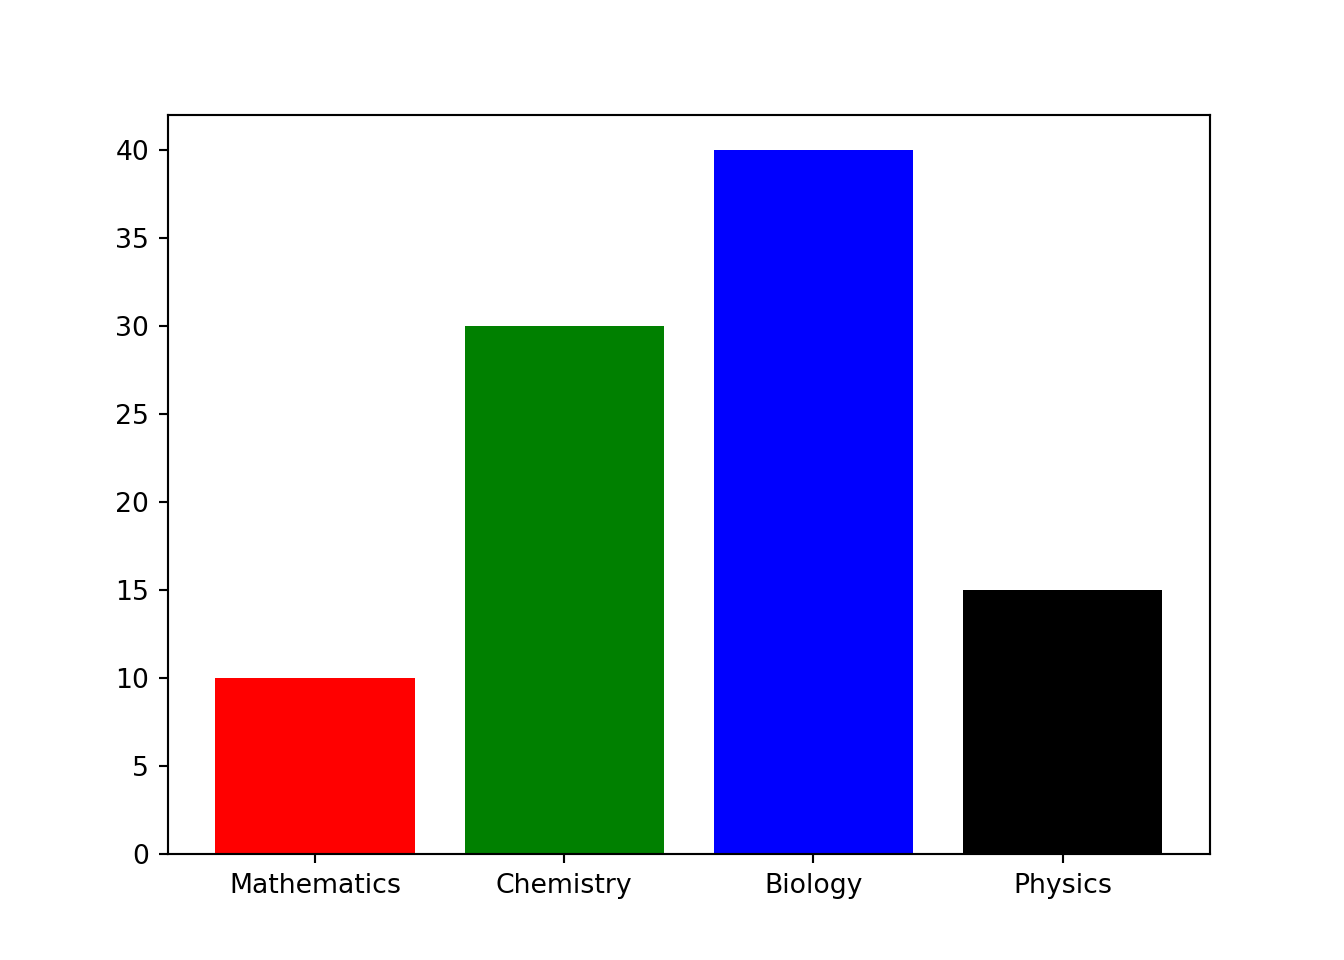
Bar Charts
subjects = ['Mathematics','Chemistry','Biology','Physics']
students = [10,30,40,15]

plt.bar(subjects,students,color=['r','g','b','k'])
plt.show()
## <BarContainer object of 4 artists>
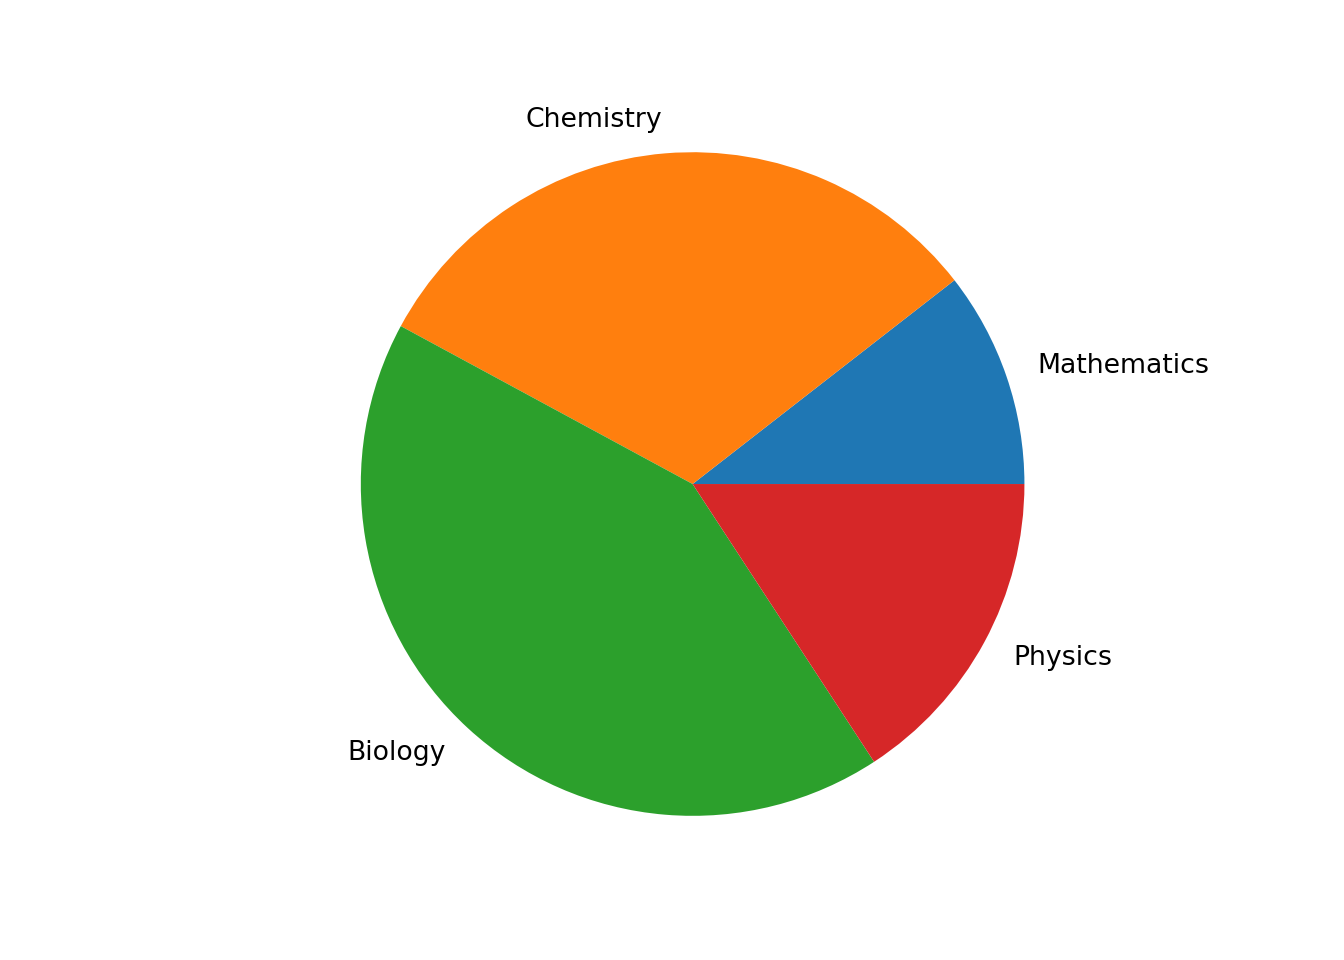
Pie Charts
subjects = ['Mathematics','Chemistry','Biology','Physics']
students = [10,30,40,15]

plt.pie(students,labels=subjects)
plt.axis('equal')
plt.show()
## ([<matplotlib.patches.Wedge object at 0x7f7aac972240>, <matplotlib.patches.Wedge object at 0x7f7aac97f780>, <matplotlib.patches.Wedge object at 0x7f7aac97fc50>, <matplotlib.patches.Wedge object at 0x7f7aac98b160>], [Text(1.0404,0.357169,'Mathematics'), Text(-0.0908372,1.09624,'Chemistry'), Text(-0.74501,-0.809296,'Biology'), Text(0.967421,-0.523542,'Physics')])
## (-1.1241243868624822, 1.1011487803267848, -1.116217534089667, 1.1115714775171943)