3.5 Lets start using numpy
Load the package
import numpy as np # Import numpy package and access it as 'np'3.5.1 A simple plot using numpy
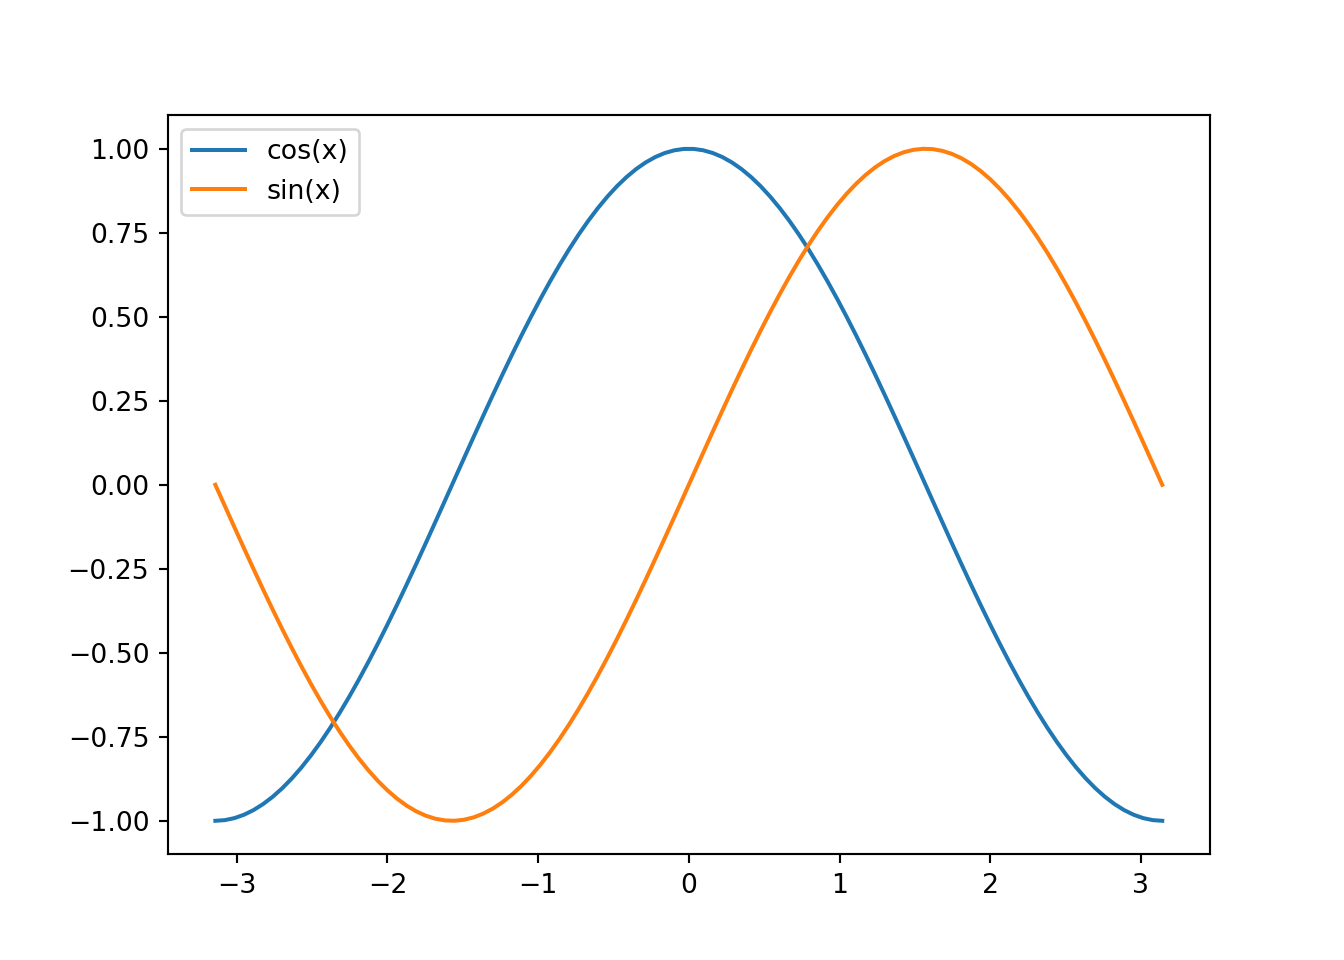
#--- Use numpy to generate (evenly spaced) x values --#
X = np.linspace(-np.pi, np.pi, num=100, endpoint=True)                 # This quickly creates 100 pointsbetween -pi and pi

#--------- Generate cosine and sine values --------#
C = np.cos(X)                                                          # Calculate cos(x)
S = np.sin(X)                                                          # Calculate sin(x)

#------------------ Plot the data -----------------#
plt.plot(X,C,label='cos(x)')                                           # Plot cosine x
plt.plot(X,S,label='sin(x)')                                           # Plot sine x
plt.legend()                                                           # Show the legend
plt.show()