4.1 Intensities of Red, Green and Blue
- Please upload the file ‘golgi-frame_all.tif’ into Colab before you do the following. View \(\longrightarrow\) Table of Contents \(\longrightarrow\) Files \(\longrightarrow\) UPLOAD
The following Python code finds the total intensity for the three RGB colours10. We will then plot the variation of the RED and GREEN intensities with time.
img = io.imread('golgi-frame_all.tif')
no_of_frames, no_of_rows, no_of_columns, no_of_layers = img.shape       # Get video info

#--------------------------------------------------------------------------------#
#                                                                                #
#                                Extract the Data                                #
#                                                                                #
#--------------------------------------------------------------------------------#
intense_data = np.zeros([3,17])                                        # To hold the data for each frame.
                                                                        #17 frames, 3 layers each
for frame in range(no_of_frames):                                       # Go through All frames
    for layer in range(no_of_layers):                                   # Go through All layers for each frame
        intense_data[layer,frame] = np.sum(img[frame,...,layer])

#--------------------------------------------------------------------------------#
#                                                                                #
#                               Normalize the Data                               #
#                                                                                #
#--------------------------------------------------------------------------------#
# I.e. use largest value to divide throughout to get 1 as the maximum

max_intensity = np.max(intense_data)                                   # What is the maximum
intense_data = intense_data/max_intensity                             # Normalize

#--------------------------------------------------------------------------------#
#                                                                                #
#                                 Plot the Data                                  #
#                                                                                #
#--------------------------------------------------------------------------------#
layer_names = ['Red','Green','Blue']                                    # Labels for the layers

plt.clf()
for layer in range(no_of_layers):
    plt.plot(intense_data[layer],label = layer_names[layer],color=layer_names[layer])

plt.legend()
plt.grid()
plt.xlabel('Frame')
plt.ylabel('Total intensity (AU)')
plt.show()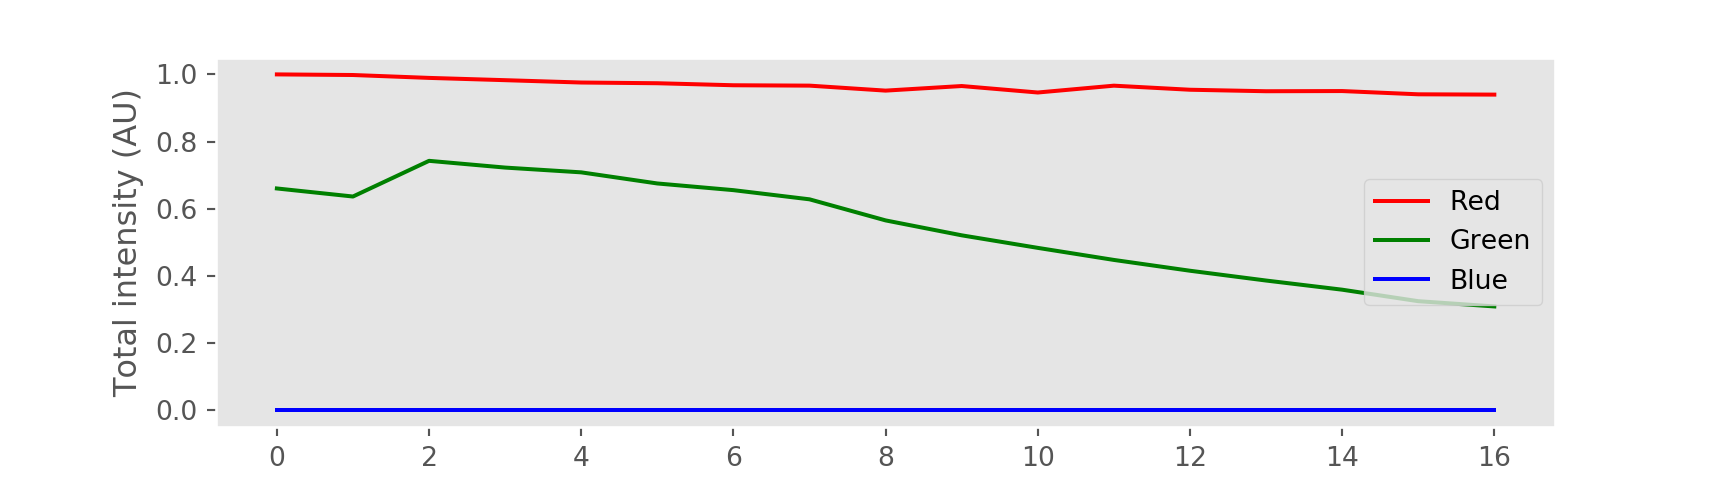
E.g. the RED intensity is the sum of all the RED counts in a frame.↩